. 2015 Jul 1;137(25):8086-95.
doi: 10.1021/jacs.5b00749. Epub 2015 Jun 22.

Ligand-Induced Proton Transfer and Low-Barrier Hydrogen Bond Revealed by X-ray Crystallography

Affiliations

Ligand-Induced Proton Transfer and Low-Barrier Hydrogen Bond Revealed by X-ray Crystallography

Derek A Nichols et al. J Am Chem Soc. .

Abstract

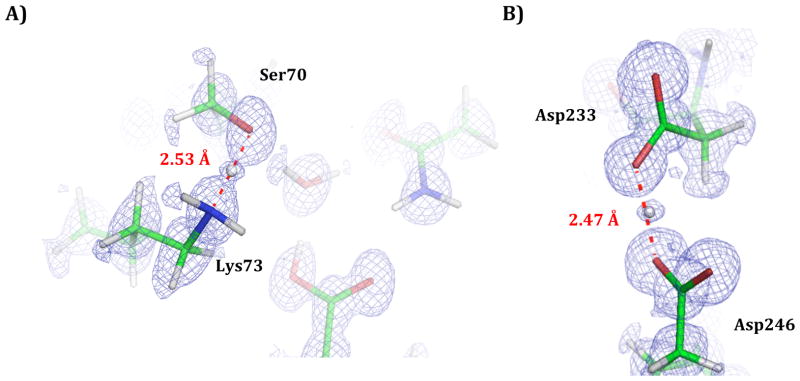
Ligand binding can change the pKa of protein residues and influence enzyme catalysis. Herein, we report three ultrahigh resolution X-ray crystal structures of CTX-M β-lactamase, directly visualizing protonation state changes along the enzymatic pathway: apo protein at 0.79 Å, precovalent complex with nonelectrophilic ligand at 0.89 Å, and acylation transition state (TS) analogue at 0.84 Å. Binding of the noncovalent ligand induces a proton transfer from the catalytic Ser70 to the negatively charged Glu166, and the formation of a low-barrier hydrogen bond (LBHB) between Ser70 and Lys73, with a length of 2.53 Å and the shared hydrogen equidistant from the heteroatoms. QM/MM reaction path calculations determined the proton transfer barrier to be 1.53 kcal/mol. The LBHB is absent in the other two structures although Glu166 remains neutral in the covalent complex. Our data represents the first X-ray crystallographic example of a hydrogen engaged in an enzymatic LBHB, and demonstrates that desolvation of the active site by ligand binding can provide a protein microenvironment conducive to LBHB formation. It also suggests that LBHBs may contribute to stabilization of the TS in general acid/base catalysis together with other preorganized features of enzyme active sites. These structures reconcile previous experimental results suggesting alternatively Glu166 or Lys73 as the general base for acylation, and underline the importance of considering residue protonation state change when modeling protein-ligand interactions. Additionally, the observation of another LBHB (2.47 Å) between two conserved residues, Asp233 and Asp246, suggests that LBHBs may potentially play a special structural role in proteins.


Figures

Figure 1
Figure 1. A concerted base hypothesis for the acylation half–reaction of Class A β--lactamase proposes protonation state changes prior to general acid/base catalysis
Beginning with the apo enzyme hydrogen bonding network (i) to a ground-state Michaelis complex (ii), as predicted by QM/MM calculations. The binding of the substrate is proposed to change the protonation states of Ser70, Lys73 and Glu166. A neutral Lys73 then serves as the general base to activate Ser70. The remaining stages of catalysis (stages not shown) proceed through a high-energy acylation transition state, to a low-energy acyl-enzyme intermediate. Subsequently, deacylation proceeds through a high-energy transition state and on to a post-covalent product complex.
Figure 2
Figure 2. Complex structures of CTX-M β-lactamase
The 2Fo−Fc (blue) and Fo−Fc (red) electron density maps of the ligands are contoured at 1.5 and 2 σ respectively. The positive difference peaks indicate the positions of hydrogen atoms. (A) The non-covalent complex with tetrazole-based inhibitor 1. The catalytic machinery, including Ser70 and Lys73, is directly behind the ligand and isolated from the bulk solvent. (B) The complex structure of boronic acid inhibitor 2, mimicking the acylation transition state tetrahedral intermediate.
Figure 3
Figure 3. Proton transfer and short hydrogen bond formation induced by ligand binding
Only the catalytic residues are shown. Wat1 is the catalytic water. The 2Fo−Fc maps (blue) are contoured at 1.5 σ. The positive Fo−Fc peaks (red, 2 σ) indicate the positions of hydrogen atoms. (A) Apo structure at 0.79 Å. (B) Structure of non-covalent complex with compound 1 at 0.89 Å. The hydrogen between Ser70 and Lys73 is located at equal distances from the two electronegative atoms. (C) Structure of covalent complex with compound 2 at 0.84 Å. (D) Three structures superimposed, showing the movement of Lys73 (apo, magenta; non-covalent complex, yellow; covalent complex, cyan). The arrows indicate residue movements from the apo structure to the two complexes.
Figure 4
Figure 4. Hydrogen atoms captured in 2Fo−Fc electron density maps
The small isolated peaks indicate well-ordered hydrogen atoms on carbon atoms and two hydrogens involved in LBHB. The maps are contoured at 0.5 σ to show the center of those peaks for LBHB hydrogens and to eliminate background noise. More protons can be identified in Fo−Fc maps (not shown here). (A) LBHB between Lys73 and the catalytic Ser70 in the active site. The angles involving the HB are ∠ Ser70Cβ-Ser70Oγ-H (111.7°), ∠ Ser70Oγ-H-Lys73Nζ (175.4°), and ∠ H-Lys73Nζ-Lys73Cε (114.5°). (B) LBHB involving Asp233 and Asp246. Both residues are buried with Asp233 near the protein surface but shielded from bulk solvent by Arg222 in the crystal structures. Asp246 is located deeper and closer to the protein core, and is replaced by an isoleucine in some Class A β-lactamases. The angles involving the HB are ∠ Asp233Cγ-Asp233Oδ1-H (113.9°), ∠ Asp233Oδ1-H-Asp246Oδ2 (167.0°), and ∠ H-Asp246Oδ2-Asp246Cγ (116.9°)
Figure 5
Figure 5. QM/MM Transition State and Reaction Pathway
QM/MM Replica path + Restraint Distance calculations determined the proton transfer barrier occurring between Ser70 and Lys73. A) The transition state of the proton transfer with the proton located in the middle between the two electronegative atoms. Wat1 is the catalytic water and wat4 is located in the oxyanion hole formed by the backbone amide groups of Ser70 and Ser237. Ser70 is positioned at the N-terminus of a helix. B) The reaction path plotted as a function of the QM/MM energy for the proton transfer barrier. The hydrogen is moved from Ser70 (0.0 Å) to Lys73 (0.8 Å).

References

    1. Cleland WW, Kreevoy MM. Science. 1994;264:1887. - PubMed
    1. Halkides CJ, Wu YQ, Murray CJ. Biochemistry. 1996;35:15941. - PubMed
    1. Graham JD, Buytendyk AM, Wang D, Bowen KH, Collins KD. Biochemistry. 2014;53:344. - PubMed
    1. Frey PA, Whitt SA, Tobin JB. Science. 1994;264:1927. - PubMed
    1. Westler WM, Weinhold F, Markley JL. J Am Chem Soc. 2002;124:14373. - PubMed

Publication types