. 2015 Aug;123(2):346-56.
doi: 10.1097/ALN.0000000000000731.

Resting-state Functional Magnetic Resonance Imaging Correlates of Sevoflurane-induced Unconsciousness

Affiliations

Resting-state Functional Magnetic Resonance Imaging Correlates of Sevoflurane-induced Unconsciousness

Ben Julian A Palanca et al. Anesthesiology. 2015 Aug.

Abstract

Background: Blood oxygen level-dependent (BOLD) functional magnetic resonance imaging (fMRI) has been used to study the effects of anesthetic agents on correlated intrinsic neural activity. Previous studies have focused primarily on intravenous agents. The authors studied the effects of sevoflurane, an inhaled anesthetic.

Methods: Resting-state BOLD fMRI was acquired from 10 subjects before sedation and from 9 subjects rendered unresponsive by 1.2% sevoflurane. The fMRI data were analyzed taking particular care to minimize the impact of artifact generated by head motion.

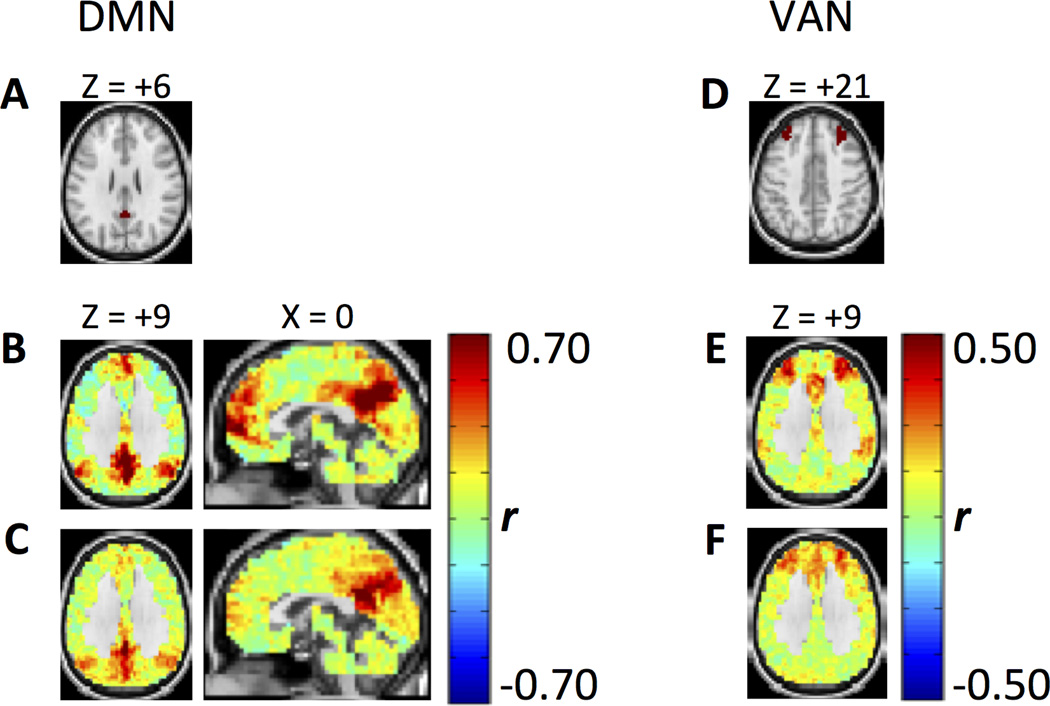
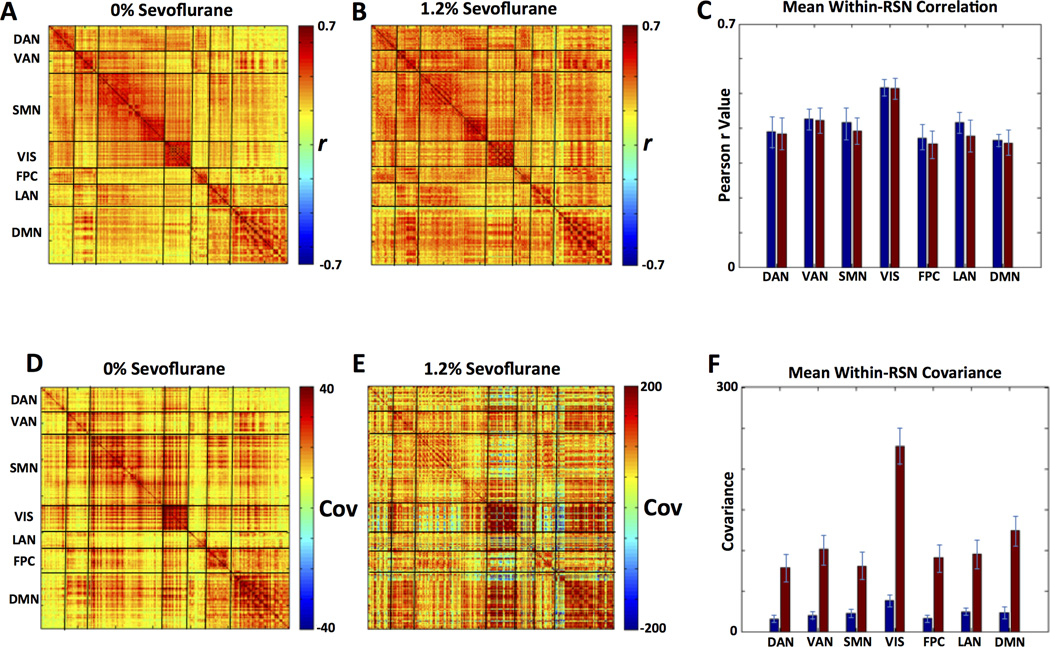
Results: BOLD correlations were specifically weaker within the default mode network and ventral attention network during sevoflurane-induced unconsciousness, especially between anterior and posterior midline regions. Reduced functional connectivity between these same networks and the thalamus was also spatially localized to the midline frontal regions. The amplitude of BOLD signal fluctuations was substantially reduced across all brain regions. The importance of censoring epochs contaminated by head motion was demonstrated by comparative analyses.

Conclusions: Sevoflurane-induced unconsciousness is associated with both globally reduced BOLD signal amplitudes and selectively reduced functional connectivity within cortical networks associated with consciousness (default mode network) and orienting to salient external stimuli (ventral attention network). Scrupulous attention to minimizing the impact of head motion artifact is critical in fMRI studies using anesthetic agents.


Figures

Fig. 1
Fig. 1. Intracortical functional connectivity
The matrices display group-averaged, Fisher z-transformed Pearson correlations (A–C) and covariance (D–E) computed for pairs of BOLD signals extracted from all regions of interest (ROIs). The ROIs are 9 × 9 × 9 mm cubes defined over all gray matter in Talairach atlas space. The ROIs are ordered in each matrix by resting state network (RSN) affiliation illustrated in Supplemental Digital Content 4. A and D: 0% sevoflurane (10 subjects). B and E: 1.2% sevoflurane (9 subjects). Bar plots represent within-network mean correlations averaged over matrix diagonal blocks, i.e., "RSN composite scores". Blue: 0% sevoflurane. Red: 1.2% sevoflurane. C: Conventional correlation. Red stars in C indicate significant sevoflurane effects (p < 0.05, two-tailed t-test, multiple comparisons [N = 7 RSNs] corrected). F: Covariance. Red stars indicate significant differences in intra-network FC (p < 0.05, two-tailed U test, multiple comparisons [N = 7 RSNs] corrected).
Fig. 2
Fig. 2. Conventional seed-based correlation maps
The plotted quantity is the (Fisher z-transformed) correlation coefficient. A: Seed region in the posterior cingulate/precuneus cortex (PCC). B: correlation map at 0% sevoflurane. C: correlation map at 1.2% sevoflurane. Note reduced functional connectivity (FC) along the anterior-posterior axis in the anesthetized condition with relatively preserved FC between the PCC and lateral parietal nodes of the default mode network (DMN). D: Seed region, bilaterally defined in fronto-polar cortex. E: correlation map at 0% sevoflurane. F: correlation map at 1.2% sevoflurane. Note reduced FC between fronto-polar cortex and posterior nodes of the ventral attention network (VAN) in the anesthetized condition with relatively preserved FC between fronto-polar and dorsal cingulate cortex. Talairach coordinates next to maps represent plane of section. Seed Talairach coordinates are previously reported.
Fig. 3
Fig. 3. Conventional thalamocortical functional connectivity
The seed is the whole-thalamus shown in Supplemental Digital Content 4. A: 0% sevoflurane. B: 1.2% sevoflurane. Note reduced thalamocortical functional connectivity (FC) over the mesial surface of each hemisphere (X = 0) in the anesthetized condition. C: Ensemble measures of thalamocortical FC in the 7 resting state networks (RSNs) illustrated in Supplemental Digital Content 4. The plotted quantity is the (Fisher z-transformed) correlation coefficient averaged over cortical voxels assigned to each RSN ("ensemble measure"). Blue and red bars indicate 0% and 1.2% sevoflurane, as in fig. 1. Red stars indicate significant sevoflurane effects (p < 0.05, two-tailed t-test, Bonferroni-corrected). Note strongest effect of anesthesia in the default mode network (DMN) and the ventral attention network (VAN).
Fig. 4
Fig. 4. Covariance-based thalamocortical functional connectivity
The format of this figure is identical to that of fig. 3. A and B show covariance-based functional connectivity (FC) maps computed using the whole-thalamus seed shown in Supplemental Digital Content 4. Note reduction in covariance between thalamus and anterior midline structures (X = 0) in the anesthetized condition. C: Ensemble measures of thalamocortical covariance values averaged over cortical voxels assigned to the 7 resting state networks (RSNs) illustrated in Supplemental Digital Content 4. Blue: 0% sevoflurane. Red: 1.2% sevoflurane. Note significant reductions in covariance-based thalamocortical FC in the dorsal attention network (DAN), ventral attention network (VAN), and default mode network (DMN) (red stars, p < 0.05, U test, Bonferroni-corrected).
Fig. 5
Fig. 5. Effect of omitting motion censoring in data acquired during sevoflurane anesthesia
The format of this figure is identical to that of fig. 1 but display analyses of data that have not undergone motion censoring. A and D: 0% sevoflurane. B and E: 1.2% sevoflurane. A–C: Correlation. D–F: Covariance. The bar plots are computed identically to those in fig. 1. Red stars are omitted in F as the observed differences are artifactual. Also note also different scales for covariance compared to figs. 1C and 1F.

References

    1. Franks NP. General anaesthesia: from molecular targets to neuronal pathways of sleep and arousal. Nat Rev Neurosci. 2008;9:370–386. - PubMed
    1. Alkire MT, Hudetz AG, Tononi G. Consciousness and anesthesia. Science. 2008;322:876–880. - PMC - PubMed
    1. Imas OA, Ropella KM, Ward BD, Wood JD, Hudetz AG. Volatile anesthetics disrupt frontal-posterior recurrent information transfer at gamma frequencies in rat. Neurosci Lett. 2005;387:145–150. - PubMed
    1. Lee U, Ku S, Noh G, Baek S, Choi B, Mashour GA. Disruption of frontal-parietal communication by ketamine, propofol, and sevoflurane. Anesthesiology. 2013;118:1264–1275. - PMC - PubMed
    1. Ogawa S, Lee TM, Nayak AS, Glynn P. Oxygenation-sensitive contrast in magnetic resonance image of rodent brain at high magnetic fields. Magn Reson Med. 1990;14:68–78. - PubMed

Publication types