. 2015 Jun;71(Pt 6):1228-37.
doi: 10.1107/S139900471500423X. Epub 2015 May 14.

Structure determination of an integral membrane protein at room temperature from crystals in situ

Affiliations

Structure determination of an integral membrane protein at room temperature from crystals in situ

Danny Axford et al. Acta Crystallogr D Biol Crystallogr. 2015 Jun.

Abstract

The structure determination of an integral membrane protein using synchrotron X-ray diffraction data collected at room temperature directly in vapour-diffusion crystallization plates (in situ) is demonstrated. Exposing the crystals in situ eliminates manual sample handling and, since it is performed at room temperature, removes the complication of cryoprotection and potential structural anomalies induced by sample cryocooling. Essential to the method is the ability to limit radiation damage by recording a small amount of data per sample from many samples and subsequently assembling the resulting data sets using specialized software. The validity of this procedure is established by the structure determination of Haemophilus influenza TehA at 2.3 Å resolution. The method presented offers an effective protocol for the fast and efficient determination of membrane-protein structures at room temperature using third-generation synchrotron beamlines.

Keywords: in situ data collection; membrane protein; multiple data sets; synchrotron beamline.


Figures

Figure 1
Figure 1
Example section of a diffraction image with spots extending to 2.1 Å resolution into the corners of the detector. The inset at the top right is an on-beam-axis view of two example crystals located at the edge of a crystallization drop captured during data collection. The red circle represents the full-width half-maximum of the beam profile and has been matched to the crystal size. The matching of the beam size to that of the crystal optimized the signal-to-noise ratio of the data.
Figure 2
Figure 2
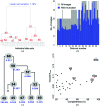
Crystal selection and data processing carried out with BLEND. (a) Dendrogram showing all integrated data sets and their merging nodes, with two major clusters at nodes 60 and 61. (b) Graph showing the number of measured images in each wedge of data (grey bars) and the number of accepted images (blue bars) after radiation-damage assessment. (c) Final stage of data processing. The R meas for each cluster (represented by a grey circle) is displayed in blue next to the node. (d) Plot of R meas versus completeness for all subclusters of cluster 60, at 2.3 Å resolution, after the removal of data sets 45 and 46. Cluster 60a (red dot) includes the same data sets as cluster 60b (blue dot), but with some images removed, after correction for radiation damage. The reduction in R meas is evident.
Figure 3
Figure 3
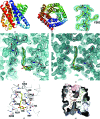
Crystal structure of HiTehA from in situ and cryogenic data. Cartoon representation of TehA (a) parallel to the membrane and (b) from the periplasmic face. The structure is coloured in a rainbow from the N-terminus (blue) to the C-terminus (red). (c) 2F oF c electron-density map section within TM9 contoured at 1.0σ with the model in stick represention with carbon in yellow, nitrogen in blue and oxygen in red. Clear electron density is visible for the highly conserved gating residue Phe262. (d) 2F oF c electron-density map for OG with its proximate residues from the in situ 2.3 Å resolution data contoured at 1σ. (e) The same representation as in (d) for the 1.5 Å resolution 100 K structure. (f) Ribbon representation with the OG detergent molecule and surrounding side chains shown as sticks. (g) A slice through the channel shows the path with the gating residue Phe262 (red sticks) on TM9. The OG detergent is bound to HiTehA on the cytoplasmic side and reaches deep into the hydrophobic channel.
Figure 4
Figure 4
Comparison of the in situ and cryogenic structures. (a) The two models superimpose quite well in general. One notable exception is the loop connecting TM6 and TM7, as detailed in (b). This shifting loop is located towards the adjacent monomer and is proximate to the C-terminal region. (c) Colour representation of B factor across the chain for the two models. The blue to red spectrum indicates low to high B factors. The structure obtained with the in situ data exhibits higher B factors, especially at the ends of the helices C-terminal to TM10, than the cryogenic structure. The respective overall B factors are 26.4 Å2 for the 295 K structure and 24.4 Å2 for the 100 K structure. On average, the intracellular part of the models has a higher B factor than the extracellular part owing to the presence of larger loops.
Figure 5
Figure 5
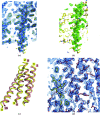
The quality of the electron-density maps reflects the good quality of the in situ data. (a) 2F oF c electron-density map after an OMIT map related to a C-terminal HiTehA deletion including TM10. The map is calculated at 2.3 Å resolution and contoured at 1.0σ. The fitted TM10 is shown for clarity. (b) Positive F o − F c electron-density map at 2.3 Å resolution contoured at 3.0σ showing the missing TM10. TM10 is also shown here for clarity. (c) The four-transmembrane-helix search model. The TM1–TM4 helices (yellow) superimpose well onto the TM7–TM10 helices (salmon). (d) 2F oF c electron-density map calculated using the molecular-replacement phases at 2.3 Å resolution contoured at 1.0σ. The missing part of the structure in the search model is revealed in the electron-density map and is well connected, with visible density for the side chains; the initial search model (yellow) and the built model (salmon red) are shown.

Comment in

References

    1. Adams, P. D. et al. (2010). Acta Cryst. D66, 213–221. - PubMed
    1. Axford, D. et al. (2012). Acta Cryst. D68, 592–600. - PMC - PubMed
    1. Barends, T. R. M., Foucar, L., Botha, S., Doak, R. B., Shoeman, R. L., Nass, K., Koglin, J. E., Williams, G. J., Boutet, S., Messerschmidt, M. & Schlichting, I. (2014). Nature (London), 505, 244–247. - PubMed
    1. Broennimann, C., Eikenberry, E. F., Henrich, B., Horisberger, R., Huelsen, G., Pohl, E., Schmitt, B., Schulze-Briese, C., Suzuki, M., Tomizaki, T., Toyokawa, H. & Wagner, A. (2006). J. Synchrotron Rad. 13, 120–130. - PubMed
    1. Chapman, H. N. et al. (2011). Nature (London), 470, 73–77. - PubMed

Publication types

MeSH terms

Associated data