. 2015 Jun;71(Pt 6):1400-10.
doi: 10.1107/S1399004715006902. Epub 2015 May 23.

A revised partiality model and post-refinement algorithm for X-ray free-electron laser data

Affiliations

A revised partiality model and post-refinement algorithm for X-ray free-electron laser data

Helen Mary Ginn et al. Acta Crystallogr D Biol Crystallogr. 2015 Jun.

Abstract

Research towards using X-ray free-electron laser (XFEL) data to solve structures using experimental phasing methods such as sulfur single-wavelength anomalous dispersion (SAD) has been hampered by shortcomings in the diffraction models for X-ray diffraction from FELs. Owing to errors in the orientation matrix and overly simple partiality models, researchers have required large numbers of images to converge to reliable estimates for the structure-factor amplitudes, which may not be feasible for all biological systems. Here, data for cytoplasmic polyhedrosis virus type 17 (CPV17) collected at 1.3 Å wavelength at the Linac Coherent Light Source (LCLS) are revisited. A previously published definition of a partiality model for reflections illuminated by self-amplified spontaneous emission (SASE) pulses is built upon, which defines a fraction between 0 and 1 based on the intersection of a reflection with a spread of Ewald spheres modelled by a super-Gaussian wavelength distribution in the X-ray beam. A method of post-refinement to refine the parameters of this model is suggested. This has generated a merged data set with an overall discrepancy (by calculating the R(split) value) of 3.15% to 1.46 Å resolution from a 7225-image data set. The atomic numbers of C, N and O atoms in the structure are distinguishable in the electron-density map. There are 13 S atoms within the 237 residues of CPV17, excluding the initial disordered methionine. These only possess 0.42 anomalous scattering electrons each at 1.3 Å wavelength, but the 12 that have single predominant positions are easily detectable in the anomalous difference Fourier map. It is hoped that these improvements will lead towards XFEL experimental phase determination and structure determination by sulfur SAD and will generally increase the utility of the method for difficult cases.

Keywords: free-electron laser; partiality; post-refinement.


Figures
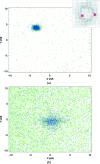
Figure 1
Figure 1
Spot positions were allowed to migrate around a 21 × 21 box centred on the original predicted position. The pixel shift in X and Y coordinates from the original starting point was retained for each reflection. These pixel shifts were aggregated for each panel. The X and Y pixel shifts of each reflection on a single panel were plotted against each other, as above. The average intensity counts were calculated for each panel. Green reflections are those below the average, whereas blue reflections are those above the average intensity. (a) This panel is the third panel from the left and five panels down from the top of the detector. The most common shift in this panel was easily resolved. The applied shift for this panel was (−3.2, 4.4) pixels in X, Y coordinates. (b) This panel is the second panel from the right and five panels down from the top of the detector, plotted at an incorrect detector distance to show streaking along the X axis, but the most common shift could still be resolved and was at (0.2, −0.5) pixels. Because the data were weaker than those in (a), more spots incorrectly focused on noise and deviated from the common shift of (0.2, −0.5).
Figure 2
Figure 2
Foreground and background masks used to calculate the integrated signal of each reflection, using the simple shoebox during initial orientation-matrix refinement (a) and an elliptical shoebox based on the energy bandwidth (b).
Figure 3
Figure 3
Each reflection in a given image will lie on a particular radius of Ewald sphere and have a calculated partiality, as derived from the partiality model described in §2. The red circled lines in (a), (b) and (c) plot the calculated partiality against the Ewald radius on which the rlp lies, divided into three equal resolution bins. This image has been put on the same scale as the merged data set. We can describe the intensity of a reflection on a single image as a percentage of the reference intensity, plotted as a black line with a grey fill. For example, a reflection to the extreme left or right of any of these panels does not lie on any Ewald sphere corresponding to the beam wavelengths and will be essentially 0% of the reference intensity. A reflection in the centre of the plots, however, has a large area of intersection with the peak Ewald sphere, and thus will be around 100% of the reference intensity. The agreement between the red and black lines should be as close as possible. (a) plots reflections from the lowest resolution to 2.31 Å, (b) those from 2.31 to 1.83 Å and (c) those from 1.83 to 1.42 Å. (d, e) These plots aggregate reflections across all images up to 2.5 Å resolution, where the calculated partiality for each reflection [equivalent to the red line in (a), (b) and (c)] is plotted against the percentage of the merged data set [equivalent to the black line in (a), (b) and (c)]. (d) is plotted for the initial merge and (e) is plotted after the final cycle of post-refinement. A random 5% of data using only positive-intensity reflections are plotted for clarity.
Figure 4
Figure 4
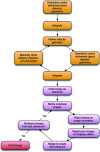
Diagram showing the flow of software during the post-refinement of XFEL data.
Figure 5
Figure 5
Electron-density map (2mF oDF c) from reflections associated with PDB entry 4s1l to 1.75 Å resolution (Ginn et al., 2015 ▶) associated with Trp163 (a) and Lys52 (d), their corresponding electron density in the initial merge for the higher resolution data set, (b) and (e), and the final presented 1.46 Å resolution structure, (c) and (f), at a σ of 1.5. The Lys52 side chain shows the prominence of the H atoms on the methylene groups, which are not pronounced on the perpendicular profile. The N, C and O atoms are distinguishable compared with the 1.75 Å resolution structure. The high-resolution information beyond 1.75 Å and post-refinement of this data set appear to have separate sequential improvements on the quality of the electron density compared with the 4s1l structure.
Figure 6
Figure 6
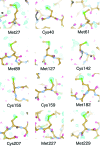
Anomalous signal contoured at 2.4σ highlighted for 12 S atoms as labelled. The highest density is 5.43σ (Met182) and the lowest is 2.53σ (Met70 and Met89). The average peak σ is 3.87.
Figure 7
Figure 7
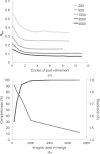
(a) Calculated R split values for subsets of images between 200 and 4000 in number, using a final correlation merge threshold of 0.9. (b) Maximum resolution (light grey line) denotes the first resolution shell beyond which CC1/2 falls below 0.3. Completeness (dark grey line) is calculated from low resolution to the resolution cutoff. This suggests that even 1000 crystals will give a useful data set comparable to that reported for data collected at a synchrotron from a similar number of crystals (Gildea et al., 2014 ▶).
Figure 8
Figure 8
Orientation matrices for 1500 crystals were applied to a (1, 1, 1) coordinate and the point was plotted against the corresponding perpendicular axes, including symmetry-related points owing to cubic space-group symmetry. This shows an even sampling of crystal orientations.

References

    1. Adams, P. D. et al. (2010). Acta Cryst. D66, 213–221. - PubMed
    1. Barends, T. R. et al. (2013). Acta Cryst. D69, 838–842. - PubMed
    1. Boutet, S. et al. (2012). Science, 337, 362–364. - PubMed
    1. Brehm, W. & Diederichs, K. (2014). Acta Cryst. D70, 101–109. - PubMed
    1. Decker, F.-J. (1995). AIP Conf. Proc. 333, 550.

Publication types

Associated data