. 2015 Jun 8;27(6):755-68.
doi: 10.1016/j.ccell.2015.05.002.

CXCL12-Producing Vascular Endothelial Niches Control Acute T Cell Leukemia Maintenance

Affiliations

CXCL12-Producing Vascular Endothelial Niches Control Acute T Cell Leukemia Maintenance

Lauren A Pitt et al. Cancer Cell. .

Abstract

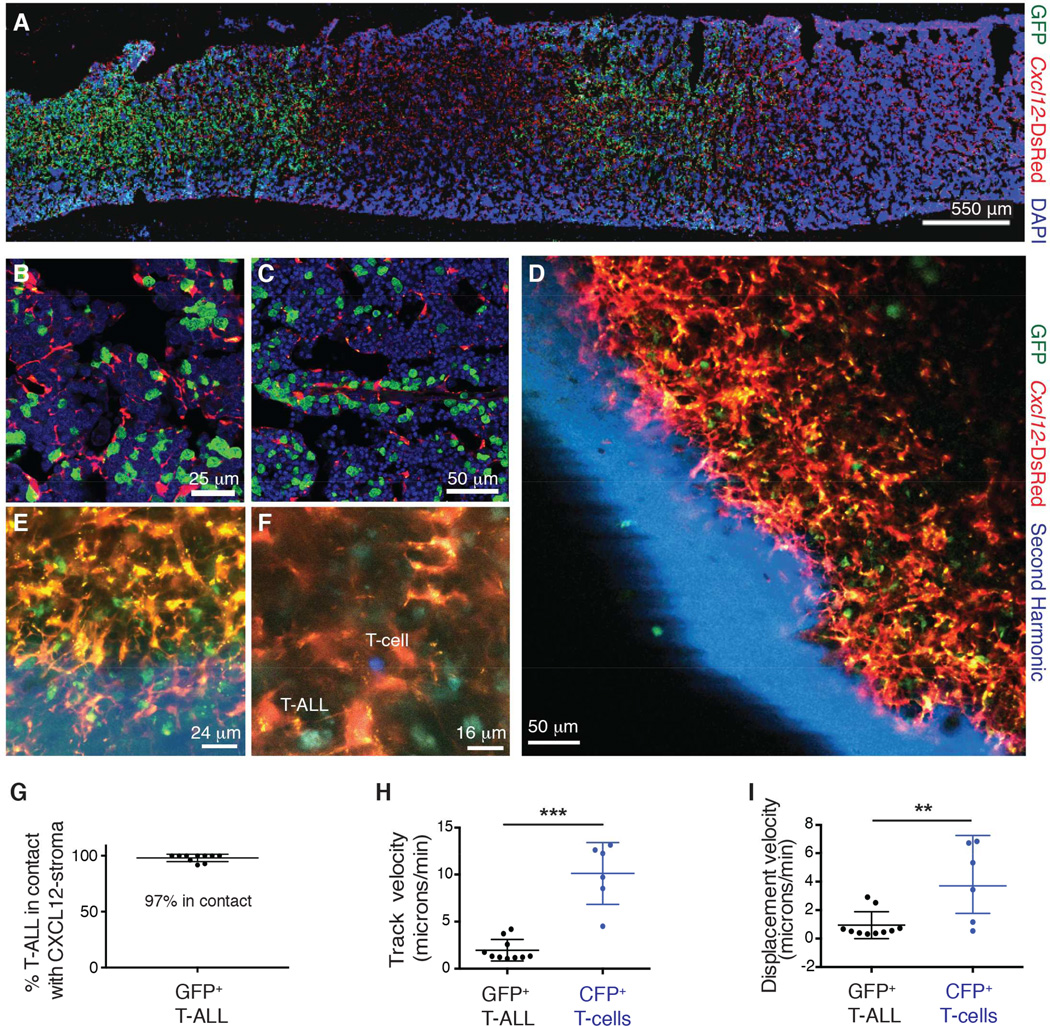
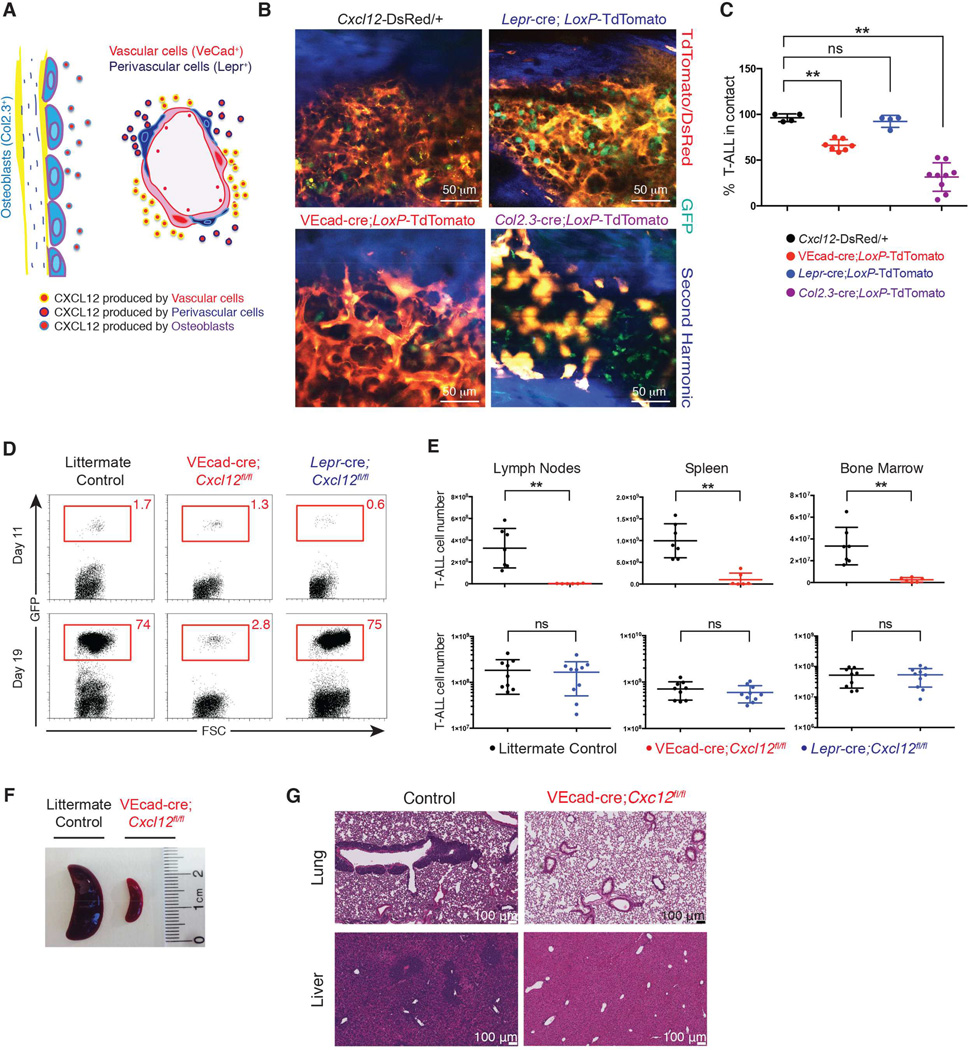
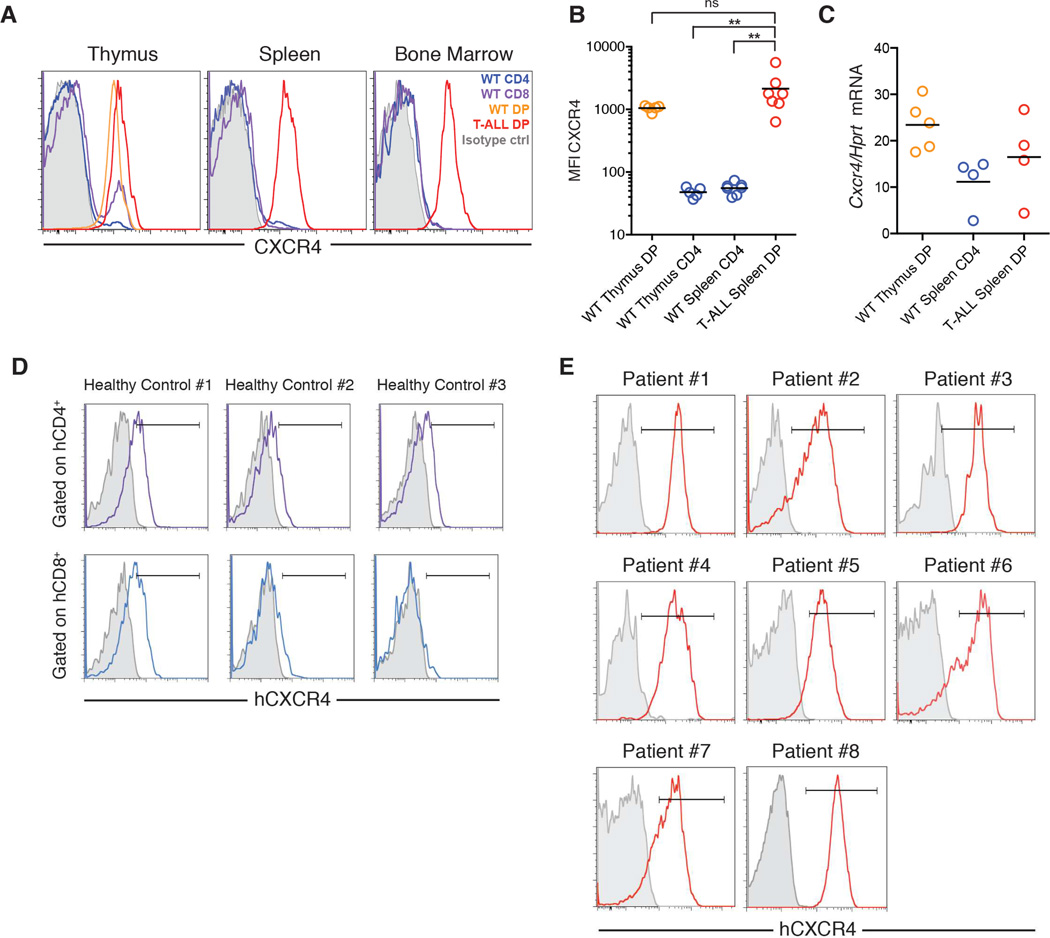
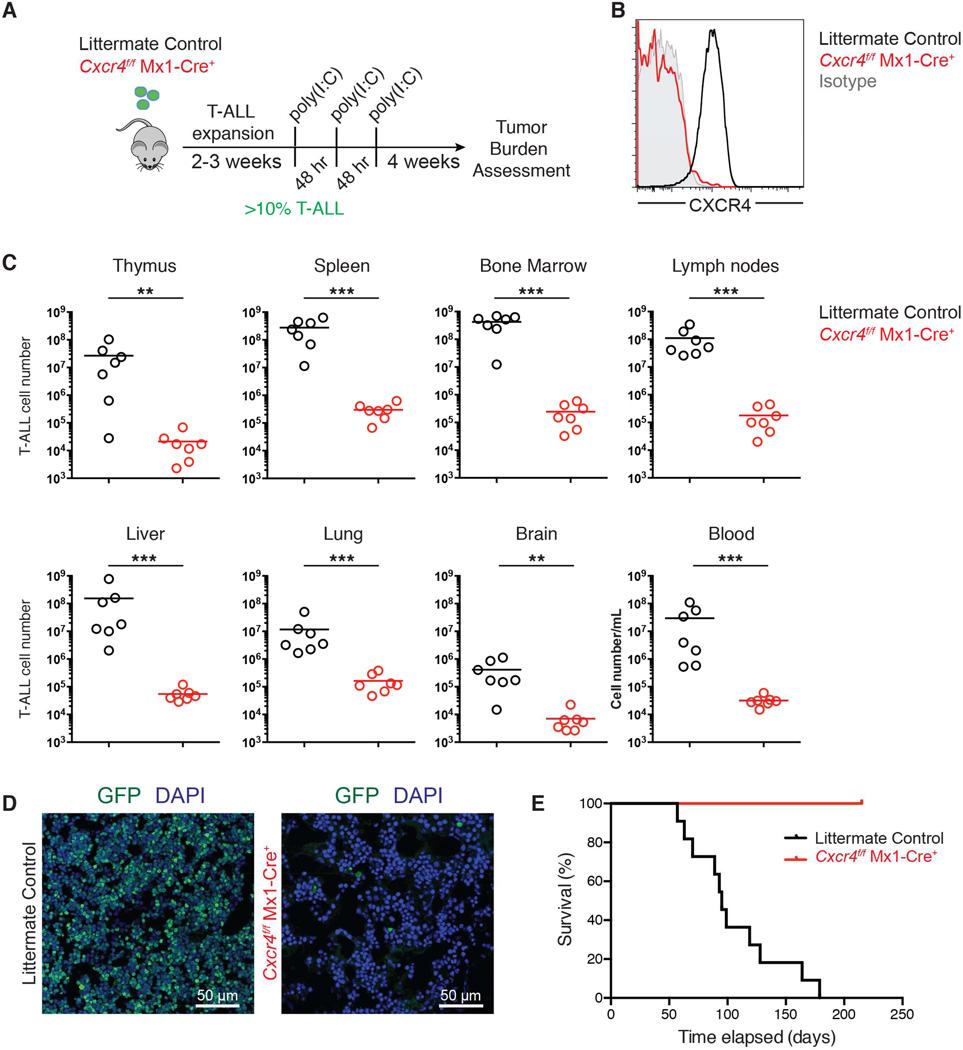
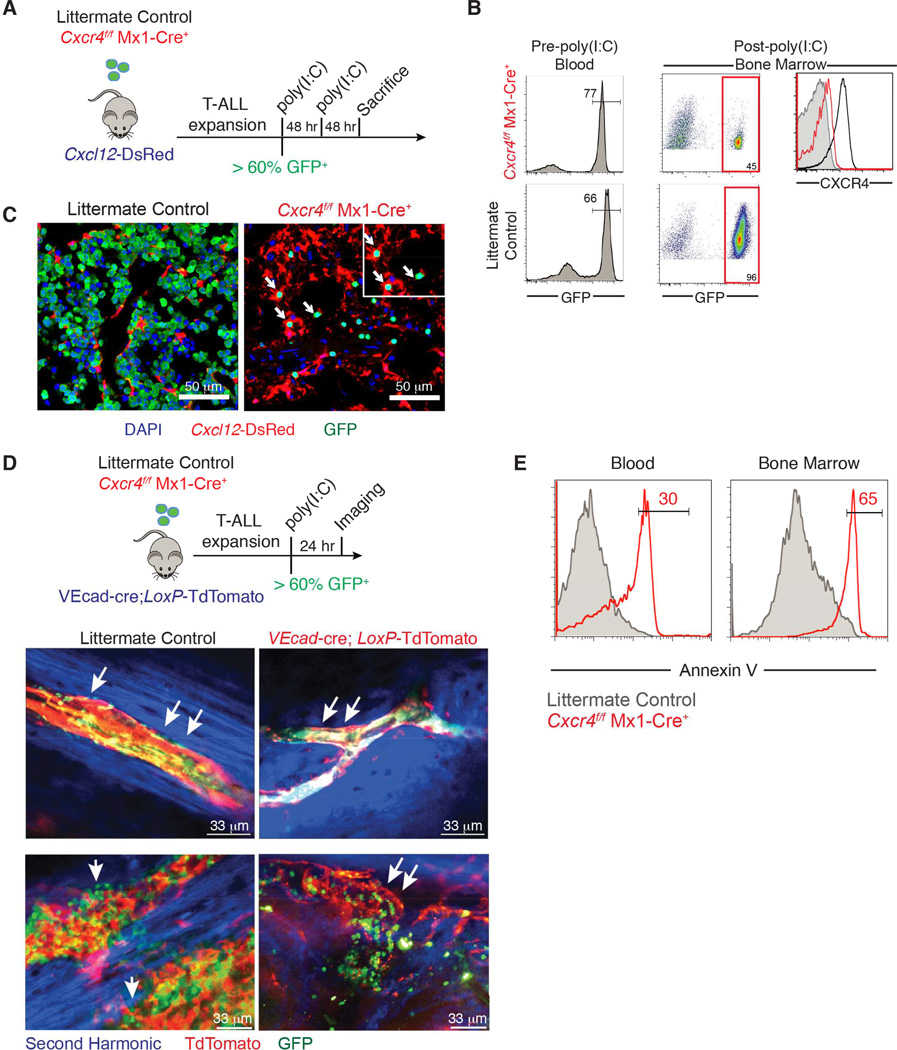
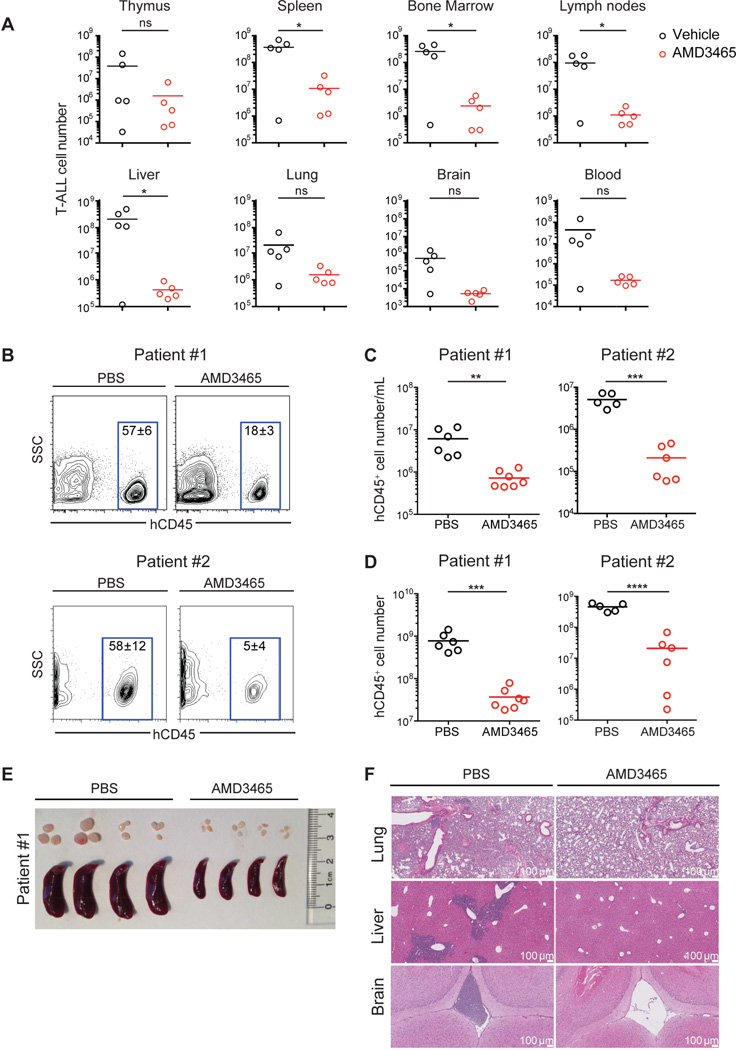
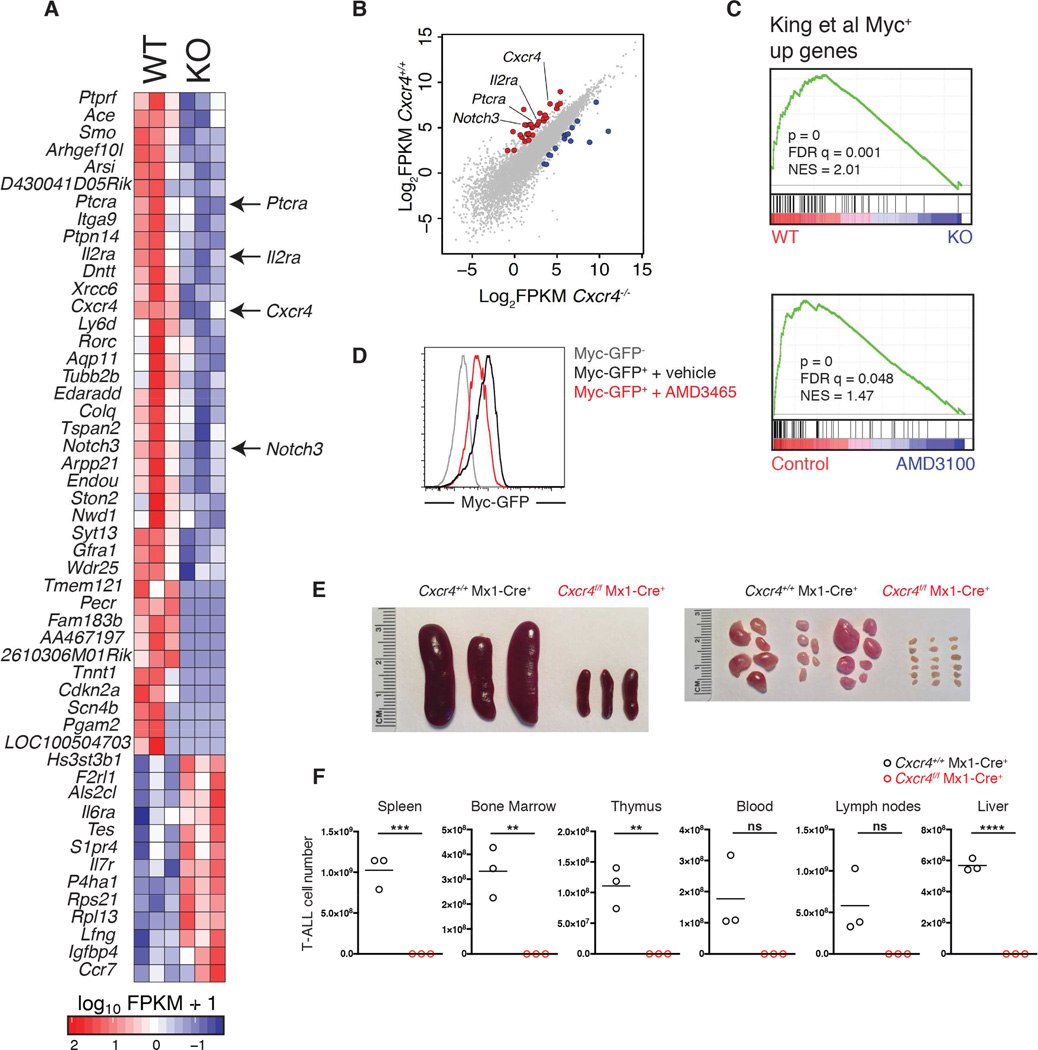
The role of the microenvironment in T cell acute lymphoblastic leukemia (T-ALL), or any acute leukemia, is poorly understood. Here we demonstrate that T-ALL cells are in direct, stable contact with CXCL12-producing bone marrow stroma. Cxcl12 deletion from vascular endothelial, but not perivascular, cells impeded tumor growth, suggesting a vascular niche for T-ALL. Moreover, genetic targeting of Cxcr4 in murine T-ALL after disease onset led to rapid, sustained disease remission, and CXCR4 antagonism suppressed human T-ALL in primary xenografts. Loss of CXCR4 targeted key T-ALL regulators, including the MYC pathway, and decreased leukemia initiating cell activity in vivo. Our data identify a T-ALL niche and suggest targeting CXCL12/CXCR4 signaling as a powerful therapeutic approach for T-ALL.


Figures

Figure 1
Figure 1. T-ALL cells interact with a CXCL12-producing niche in the bone marrow
(A–C) Representative immunofluorescence staining of femur sections from Cxcl12-DsRed mice transplanted with GFP+ T-ALL cells (n=4). (D–E) Representative high-resolution two photon images from Cxcl12-DsRed mice transplanted with GFP+ T-ALL cells. (F) Representative high-resolution two-photon image from Cxcl12-DsRed mice transplanted with GFP+ T-ALL and CFP+ CD4+ T cells. (G) Percentage of GFP+ T-ALL cells in contact with Cxcl12-DsRed+ cells. Each data point is taken from a different movie or image. (H) Track velocity and (I) displacement velocity of GFP+ T-ALL cells and CFP+ CD4+ T cells. Error bars represent +/− SD. Unless otherwise stated each panel reflects data from at least 3 independent experiments. See also Figure S1, Movie S1 and Movie S2.
Figure 2
Figure 2. CXCL12 production by vascular endothelial cells maintains T-ALL
(A) Schematic representation of CXCL12 producing populations in bone marrow. (B) Two photon images of bone marrow from Cxcl12-DsRed, VEcad-cre;LoxP-tdTomato, Lepr-cre; LoxP-tdTomato and Col2.3-cre;LoxP-tdTomato animals 1 week after transfer of GFP+ T-ALL cells. (C) Frequency of colocalization between GFP+ T-ALL and DsRed/tdTomato niche cells from Cxcl12-DsRed, VEcad-cre;LoxP-tdTomato, Lepr-cre;LoxP-tdTomato and Col2.3-cre;LoxP-tdTomato animals 1 week after transfer of leukemic cells. At least 3 animals were used for each condition. Error bars represent +/− SD. (D) Representative frequency of T-ALL GFP+ cells in blood 11 days and 19 days post secondary transplantation into VEcad-cre;Cxcl12fl/fl, Lepr-cre;Cxcl12fl/fl, or control hosts. (E) Absolute numbers of T-ALL cells in lymph nodes, spleen, and bone marrow 25 days post secondary transplantation of GFP+ T-ALL cells into VEcad-cre;Cxcl12fl/fl, Lepr-cre;Cxcl12fl/fl, or control hosts. Bone marrow numbers represent cells harvested from tibias and femurs. Data is representative of 3 experiments for VEcad-cre;Cxcl12fl/fl (n=6) or littermate sex-matched control animals (n=7) and 2 experiments for Lepr-cre;Cxcl12fl/fl (n=9) or control hosts (n=8). Error bars represent +/− SD. (F) Image of representative spleens from VEcad-cre;Cxcl12fl/fl or control animals. (G) Histology of lungs and liver from VEcad-cre;Cxcl12fl/fl or control animals. See also Figure S2.
Figure 3
Figure 3
CXCR4 is highly expressed on the surface of mouse and human T-ALL cells (A) Surface CXCR4 expression on T-ALL cells from a representative leukemic mouse and normal T cells from a healthy control. T-ALL cells were identified as CD4+CD8+GFP+. (B) Surface CXCR4 mean fluorescence intensity (MFI) on T-ALL cells and normal T cells from the indicated organs. Graph pools data from 3–5 pairs of leukemic mice and controls. Bars represent mean MFI. (C) Abundance of Cxcr4 mRNA expressed relative to Hprt mRNA in purified normal CD4+CD8+ thymocytes, normal spleen CD4+ T cells, and CD4+CD8+ T-ALL cells, measured by RT-qPCR. Bars represent the mean. (D) Surface CXCR4 expression on human peripheral blood CD4+CD3+ and CD8+CD3+ lymphocytes from healthy controls. (E) Surface CXCR4 expression on primary bone marrow human biopsies from T-ALL patients expanded in immunodeficient hosts (gated on hCD45) (Patients #1–4, #8; Patient 4 had ETP T-ALL) and primary T-ALL bone marrow biopsies (Patients #5–7). See also Figure S3.
Figure 4
Figure 4. Deletion of Cxcr4 reduces T-ALL burden and significantly prolongs survival
(A) Schematic representation of experiment design. (B) Representative surface CXCR4 staining on Cxcr4f/f Mx1-Cre+ or littermate control (Cxcr4+/+ Mx1-Cre+ or Cxcr4f/f) GFP+ T-ALL cells in the spleen one month after they were treated with poly(I:C). (C) Number of GFP+ Cxcr4f/f Mx1-Cre+ or littermate control (Cxcr4+/+ Mx1-Cre+ or Cxcr4f/f) T-ALL cells in the indicated tissues 1 month after treatment with poly(I:C) (initiated after GFP+ cells represented >10% of peripheral blood lymphocytes). Bars represent the mean. Data are pooled from 2 experiments (n=7–8). (D) Representative immunofluorescence staining of a femur section from a mouse that received Cxcr4f/f Mx1-Cre+ or littermate control T-ALL, 1 month after poly(I:C) treatment. (E) Kaplan-Meier survival graph of mice with Cxcr4f/f Mx1-Cre+ (n=10) or littermate control (Cxcr4+/+ Mx1-Cre+, n=11) T-ALL following poly(I:C) treatment (initiated after T-ALL cells reached ~10% of blood lymphocytes; first poly(I:C) injection was defined as day 1). See also Figure S4.
Figure 5
Figure 5. Effects of CXCR4 depletion on leukemic cell localization and survival
(A) Schematic representation of experiment design. (B) Left: Frequency of transplanted Cxcr4f/f Mx1-Cre+ or littermate control T-ALL GFP+ cells in the blood prior to poly(I:C) treatment. Right: Frequency of GFP+ leukemic cells and levels of CXCR4 in the bone marrow 48 hr after the second dose of poly(I:C). (C) Representative immunofluorescence staining of a femur section from Cxcl12-DsRed hosts transplanted with GFP+ Cxcr4f/f Mx1-Cre+ or littermate control T-ALL cells 48 hr after poly(I:C) treatment. (D) Top: Experiment design. Bottom: representative high-resolution two-photon image from VEcad-cre;LoxP-tdTomato mice transplanted with Cxcr4f/f Mx1-Cre+ or littermate control T-ALL 24 hr after poly(I:C) treatment. Arrows indicate presence or absence of leukemic cells on top of the vessels. (E) Annexin V staining on GFP+ Cxcr4f/f Mx1-Cre+ or littermate control T-ALL cells in blood and bone marrow 24 hr after poly(I:C) treatment (n=3). See also Figure S5 and Movies S3-S6.
Figure 6
Figure 6. Small molecule CXCR4 antagonists efficiently suppress growth of murine and human T-ALL
(A) T-ALL was induced by transfer of Notch1-ΔE-GFP transduced progenitors. After GFP+ leukemic cells reached 5% of white blood cells, osmotic pumps filled with AMD3465 (20 nmol/hour) or vehicle (PBS) were implanted s.c. Graphs show T-ALL cell number in the indicated tissues 2 weeks after treatment initiation. Bars represent the mean. (B–F) NOD-SCID mice were injected with leukemia cells from Patient #1 or #2 (represented in Figure 3E). After leukemia reached 5% of white blood cells, osmotic pumps filled with AMD3465 (25 nmol/hr) or vehicle were implanted s.c. Analysis was 2 weeks after treatment initiation. (B) Representative flow cytometric analysis of human CD45 (hCD45) expression amongst peripheral blood lymphocytes. Values represent the mean frequency of hCD45+ cells +/− SEM. (C–D) Number of hCD45+ leukemia cells per mL of peripheral blood (C) or in the spleen (D) of animals treated with AMD3465 or vehicle. Bars represent the mean. (E) Image of representative spleens and lymph nodes (Patient #1 xenograft). (F) Histology of lungs, liver and brain (Patient #1 xenograft). Data for (B–F) are representative of 6–7 mice per group using Patient #1-derived cells, or 5–6 mice per group using Patient #2-derived cells. See also Figure S6.
Figure 7
Figure 7. CXCR4 regulates a T cell-specific gene signature and promotes LIC activity in T-ALL
(A) Heat map displaying differentially expressed genes in Cxcr4f/f and Cxcr4f/f Mx1-Cre T-ALL cells 10 days after administration of poly(I:C). (B) Scatter plot comparing log2-transformed FPKM expression values for CXCR4-wild-type and -deficient T-ALL cells. Each dot represents an individual gene. Red dots represent genes of interest over-expressed in CXCR4-wild-type (y-axis) compared to CXCR4-deficient T-ALL cells (x-axis). (C) Myc expression signatures are enriched in T-ALL cells with intact CXCR4 signaling as determined by GSEA. Top: comparison of Cxcr4f/f and Cxcr4f/f Mx1-Cre T-ALL cells. Bottom: comparison of T-ALL cells treated with AMD3100 or vehicle for 4 days in vitro. (D) MYC-GFP expression by Fbxw7mut Notch1-ΔE LIC expressing a MYC-GFP fusion allele, 4 days after culture on OP9 cells in media with AMD3465 or vehicle, measured by flow cytometry. Graph represents 3 experiments. (E–F) Cxcr4f/f Mx1-Cre or control Cxcr4+/+ Mx1-Cre Notch1-ΔE+ T-ALL cells treated with poly(I:C) in vivo were isolated from spleen and bone marrow and transferred into sublethally irradiated wild-type mice (1 million cells per mouse; n=3 recipients per genotype). (E) Image shows spleens and lymph nodes harvested from secondary recipients 10 weeks post-transplantation. (F) Cell number of Cxcr4+/+ Mx1-Cre or Cxcr4f/f Mx1-Cre T-ALL cells in indicated tissues of secondary recipients 10 weeks post-transplantation, assessed by flow cytometry. Bars represent the mean. See also Figure S7.

Comment in

References

    1. Alva JA, Zovein AC, Monvoisin A, Murphy T, Salazar A, Harvey NL, Carmeliet P, Iruela-Arispe ML. VE-Cadherin-Cre-recombinase transgenic mouse: a tool for lineage analysis and gene deletion in endothelial cells. Dev Dyn. 2006;235:759–767. - PubMed
    1. Ara T, Itoi M, Kawabata K, Egawa T, Tokoyoda K, Sugiyama T, Fujii N, Amagai T, Nagasawa T. A role of CXC chemokine ligand 12/stromal cell-derived factor-1/pre-B cell growth stimulating factor and its receptor CXCR4 in fetal and adult T cell development in vivo. J Immunol. 2003;170:4649–4655. - PubMed
    1. Aster JC, Robertson ES, Hasserjian RP, Turner JR, Kieff E, Sklar J. Oncogenic forms of NOTCH1 lacking either the primary binding site for RBP-Jkappa or nuclear localization sequences retain the ability to associate with RBP-Jkappa and activate transcription. J Biol Chem. 1997;272:11336–11343. - PubMed
    1. Ayala F, Dewar R, Kieran M, Kalluri R. Contribution of bone microenvironment to leukemogenesis and leukemia progression. Leukemia. 2009;23:2233–2241. - PMC - PubMed
    1. Beider K, Darash-Yahana M, Blaier O, Koren-Michowitz M, Abraham M, Wald H, Wald O, Galun E, Eizenberg O, Peled A, Nagler A. Combination of imatinib with CXCR4 antagonist BKT140 overcomes the protective effect of stroma and targets CML in vitro and in vivo. Mol Cancer Ther. 2014;13:1155–1169. - PubMed

Publication types

MeSH terms

Substances

Associated data