. 2015 Jun 8;27(6):837-51.
doi: 10.1016/j.ccell.2015.05.006.

Kinase and BET Inhibitors Together Clamp Inhibition of PI3K Signaling and Overcome Resistance to Therapy

Affiliations

Kinase and BET Inhibitors Together Clamp Inhibition of PI3K Signaling and Overcome Resistance to Therapy

Elias E Stratikopoulos et al. Cancer Cell. .

Abstract

Unsustained enzyme inhibition is a barrier to targeted therapy for cancer. Here, resistance to a class I PI3K inhibitor in a model of metastatic breast cancer driven by PI3K and MYC was associated with feedback activation of tyrosine kinase receptors (RTKs), AKT, mTOR, and MYC. Inhibitors of bromodomain and extra terminal domain (BET) proteins also failed to affect tumor growth. Interestingly, BET inhibitors lowered PI3K signaling and dissociated BRD4 from chromatin at regulatory regions of insulin receptor and EGFR family RTKs to reduce their expression. Combined PI3K and BET inhibition induced cell death, tumor regression, and clamped inhibition of PI3K signaling in a broad range of tumor cell lines to provide a strategy to overcome resistance to kinase inhibitor therapy.


Figures

Figure 1
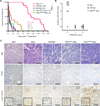
Figure 1. PI3K Pathway Alterations and MYC Cooperate in Mouse Mammary Tumorigenesis
(A) Kaplan-Meier plots of tumor occurrence in cohorts of female mice driven by MMTV-Myc and PI3K pathway alterations. The number of mice per cohort is shown in parentheses. T50 indicates median tumor latency. *p < 0.02. (B) Scatter plot showing correlation of absence of PTEN and membranous p-AKT (S473) immunostaining in Ptendel/+;Myc, HR;Myc, and Myc mouse tumors. For scoring of immunoreactivity, see Supplemental Experimental Procedures. (C) Representative sections showing H&E staining and PTEN and p-AKT (S473) immunostaining of mammary tumors in Myc, HR;Myc, Ptendel/+;Myc, and Ptendel/del;Myc female mice. Scale bars, 50 mm. See also Figure S1.
Figure 2
Figure 2. PI3K;Myc Cells Are Resistant to PI3K and BET Single Inhibition
(A) Representative sections showing H&E staining and PTEN and p-AKT (S473) immunostaining in mammary tumors from MCCL-278 and −357 allografts. Scale bars, 50 µm. (B) Representative sections showing H&E staining and PTEN and p-AKT (S473) immunostaining of lung metastases in females with MCCL-278 and MCCL-357 allografted tumors. Scale bars, 50 µm. (C) Proliferation analysis for MCCL-278 and MCCL-357 cells treated with the indicated concentrations of GDC-0941. Data represent average ± SD of three replicates. Western blot analysis for p-AKT (T308) and MYC after treatment with the same doses for 24 hr is also shown. (D) Proliferation analysis for MCCL-278 and MCCL-357 cells treated with the indicated concentrations of JQ1. Data represent average ± SD of three replicates. Western blot analysis for MYC and p-AKT (T308) after treatment with the same doses for 24 hr is also shown. See also Figure S2.
Figure 3
Figure 3. BET Inhibition Sensitizes Resistant Cells to PI3K Inhibition
(A) Proliferation analysis of indicated cells treated with 1 µM of GDC-0941 and the indicated doses of JQ1. Data represent average ± SD of three replicates. (B) Representative result showing the effects on growth of MCCL-357 cells after treatment with the indicated doses of JQ1, GDC-0941, or the combination at day 5 of treatment. (C) Fold changes in average cell growth of indicated cells after treatment with 1 µM of GDC-0941 and the indicated doses of JQ1. Values > 1 indicate reduction of total cell numbers. (D) Indicated cells were treated with 1 µM of GDC-0941, MS417, or their combination for 3 days in the presence of 1.5 µM of DRAQ7. Apoptotic red counts at the indicated time points were calculated using IncuCyte FLR object counting. Data were normalized to confluence and then to DMSO-treated samples and represent average ± SD of three replicates. (E) Heatmap showing % of inhibition of MCCL-278 and MCCL-357 cell growth after treatment with 1 µM of the indicated inhibitors for 3 days. Data represent average of two replicates. See also Figure S3.
Figure 4
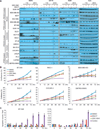
Figure 4. JQ1 Treatment Hinders Feedback Activation of the PI3K Pathway after GDC-0941 Treatment
(A) MCCL-357 and SUM-159 cells were treated with1 µM of JQ1 for the indicated time points, and the phosphorylation status of AKT and PRAS40 as well as MYC levels were assessed by western blot. (B) Western blot analysis in MCCL-357 and SUM-159 cells treated with 1 µM of GDC-0941 with or without 1 µM of JQ1 for the indicated time points. (C) Quantitative RT-PCR for mRNA levels of the indicated receptors in cells treated with 1 µM of GDC-0941 and/or JQ1 relative to DMSO-treated control cells. Results were normalized to actin and error bars indicate ± SD of three independent experiments. (D) MCCL-357 cells were grown in the presence of 0.5µM of the indicated inhibitors except for OSI-906, which was dosed at 1µM, and confluence was calculated for the indicated time points using phase-contrast images. Data represent average ± SD of three replicates. (E) Western blot analysis in MCCL-357 cells treated with the same doses of the indicated inhibitors as in (D) for 48 hr. See also Figure S4.
Figure 5
Figure 5. Combined PI3K/BET Inhibition Clamps PI3K Signal and Attenuates Cell Growth in Multiple Tumor Models
(A) Western blot analysis in cells treated with 0.5 µM of GDC-0941 and/or 0.5 µM of MS417 for the indicated time points. Dashed lines were drawn to highlight induction of RTKs after treatment with GDC-0941. (B and C) Cells were grown in the presence of 0.5 µM of the indicated inhibitors and 1.5 µM of DRAQ7. Confluence (B) was calculated using phase-contrast images and apoptotic counts (C) using IncuCyte FLR object counting. Data represent average ± SD of three replicates. See also Figure S5.
Figure 6
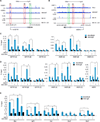
Figure 6. BET Inhibition Blocks BRD4 Binding at Regulatory Regions of RTKs in Multiple Tumor Models
(A and B) Tracks show BRD4 binding across the IGF1R (A) and INSR (B) loci in the indicated cells with or without treatment with 0.5 µM of JQ1 for 6 hr. Sites A, B, and C indicate the regions where primers were designed to test for the binding of BRD4 in ChIP-qPCR experiments. (C–E) ChIP-qPCR analysis of BRD4 binding at the indicated sites in RKO-1 (C), PC-3 (D), and MCCL-357 (E) cells treated with 0.5 µM of GDC-0941, MS417, or their combination for 6 hr. Data represent average ± SD of two qPCR experiments. *p < 0.05, **p < 0.01, ***p < 0.001. See also Figure S6.
Figure 7
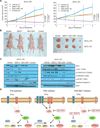
Figure 7. Antitumor Efficiency of PI3K and BET Inhibition In Vivo
(A) MCCL-278 and MCCL-357 allografts were treated with GDC-0941, MS417, or their combination. Number of mice per arm is shown in parentheses, and error bars indicate ± SD. The p values were calculated using Sidak’s multiple comparisons test. (B) Representative tumors from mice (MCCL-278 left flank and MCCL-357 right flank) treated with the indicated drugs. (C) MCCL-278 and MCCL-357 allografts were treated for 72 hr with the indicated drugs, at which point tumors were harvested and snap frozen. Effects of treatments on MYC, markers of the PI3K pathway, and induction of cleavage of Caspase-3 as an indicator of apoptosis were assessed by western blot. Results from two different animals per treatment group are shown here. (D) A schematic representation of signaling responses to inhibition of PI3K and PI3K/BET combination.

References

    1. Andrechek ER, Cardiff RD, Chang JT, Gatza ML, Acharya CR, Potti A, Nevins JR. Genetic heterogeneity of Myc-induced mammary tumors reflecting diverse phenotypes including metastatic potential. Proc. Natl. Acad. Sci. USA. 2009;106:16387–16392. - PMC - PubMed
    1. Asangani IA, Dommeti VL, Wang X, Malik R, Cieslik M, Yang R, Escara-Wilke J, Wilder-Romans K, Dhanireddy S, Engelke C, et al. Therapeutic targeting of BET bromodomain proteins in castration-resistant prostate cancer. Nature. 2014;510:278–282. - PMC - PubMed
    1. Bader AG, Kang S, Zhao L, Vogt PK. Oncogenic PI3K deregulates transcription and translation. Nat. Rev. Cancer. 2005;5:921–929. - PubMed
    1. Bandopadhayay P, Bergthold G, Nguyen B, Schubert S, Gholamin S, Tang Y, Bolin S, Schumacher SE, Zeid R, Masoud S, et al. BET bromodomain inhibition of MYC-amplified medulloblastoma. Clin. Cancer Res. 2014;20:912–925. - PMC - PubMed
    1. Bendell JC, Rodon J, Burris HA, de Jonge M, Verweij J, Birle D, Demanse D, De Buck SS, Ru QC, Peters M, et al. Phase I, dose-escalation study of BKM120, an oral pan-Class I PI3K inhibitor, in patients with advanced solid tumors. J. Clin. Oncol. 2012;30:282–290. - PubMed

Publication types

MeSH terms