. 2015 Jun 10:5:11166.
doi: 10.1038/srep11166.

A genome-wide SNP scan accelerates trait-regulatory genomic loci identification in chickpea

Affiliations

A genome-wide SNP scan accelerates trait-regulatory genomic loci identification in chickpea

Alice Kujur et al. Sci Rep. .

Abstract

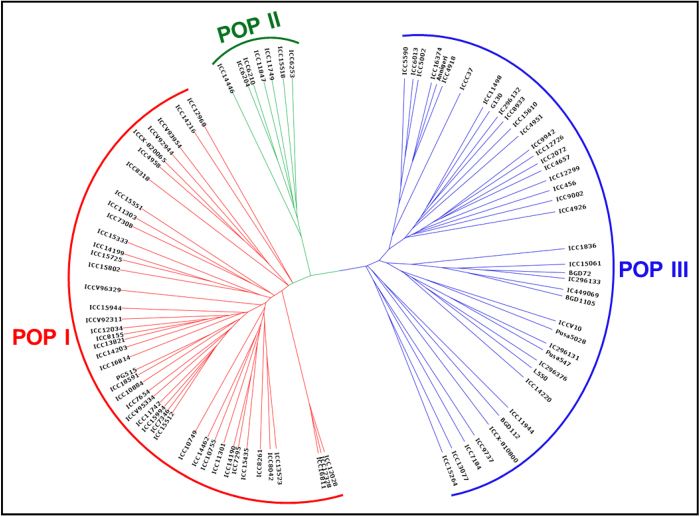
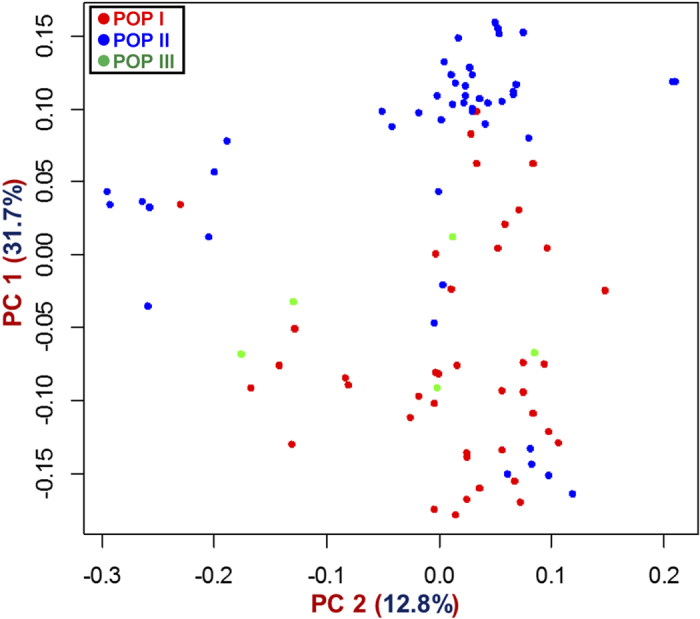
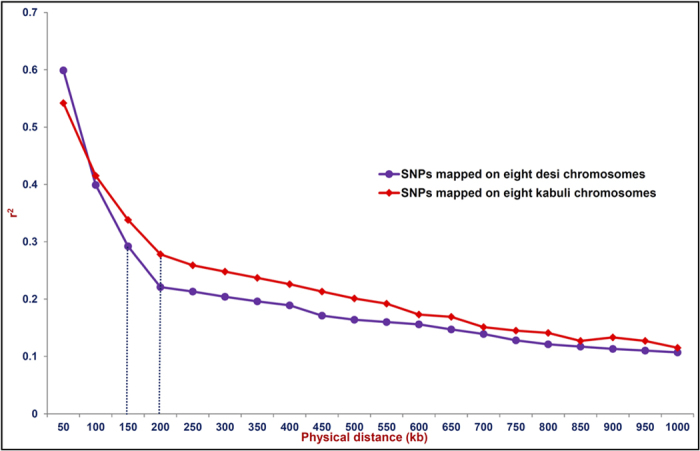
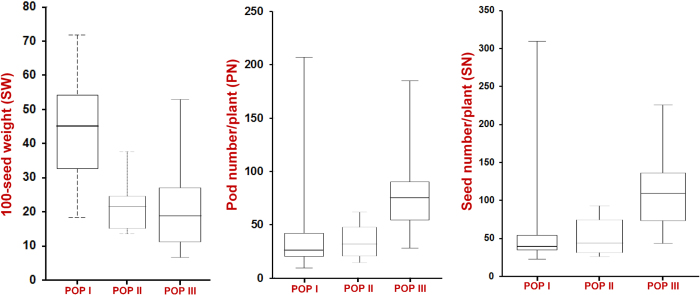
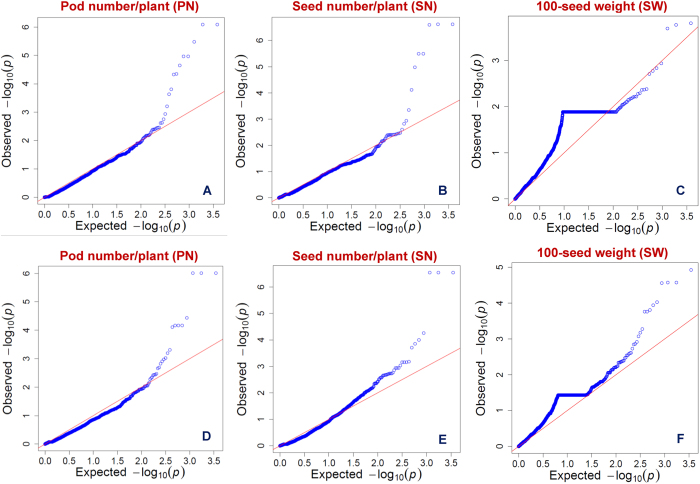
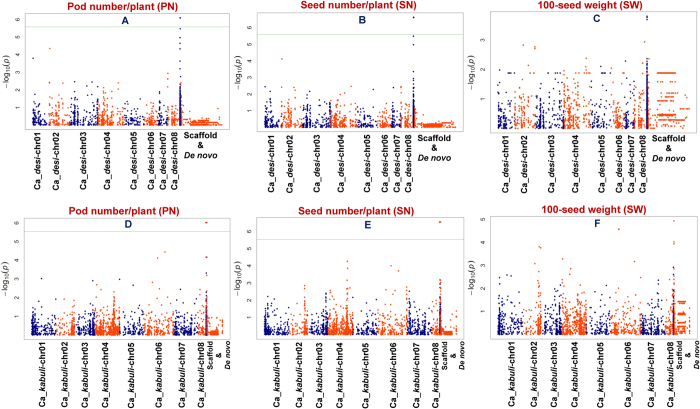
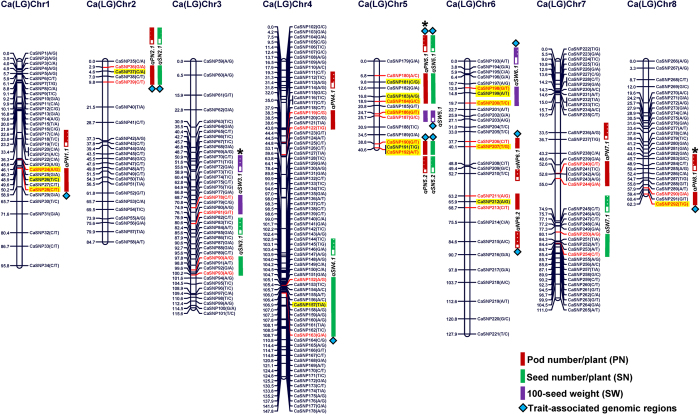
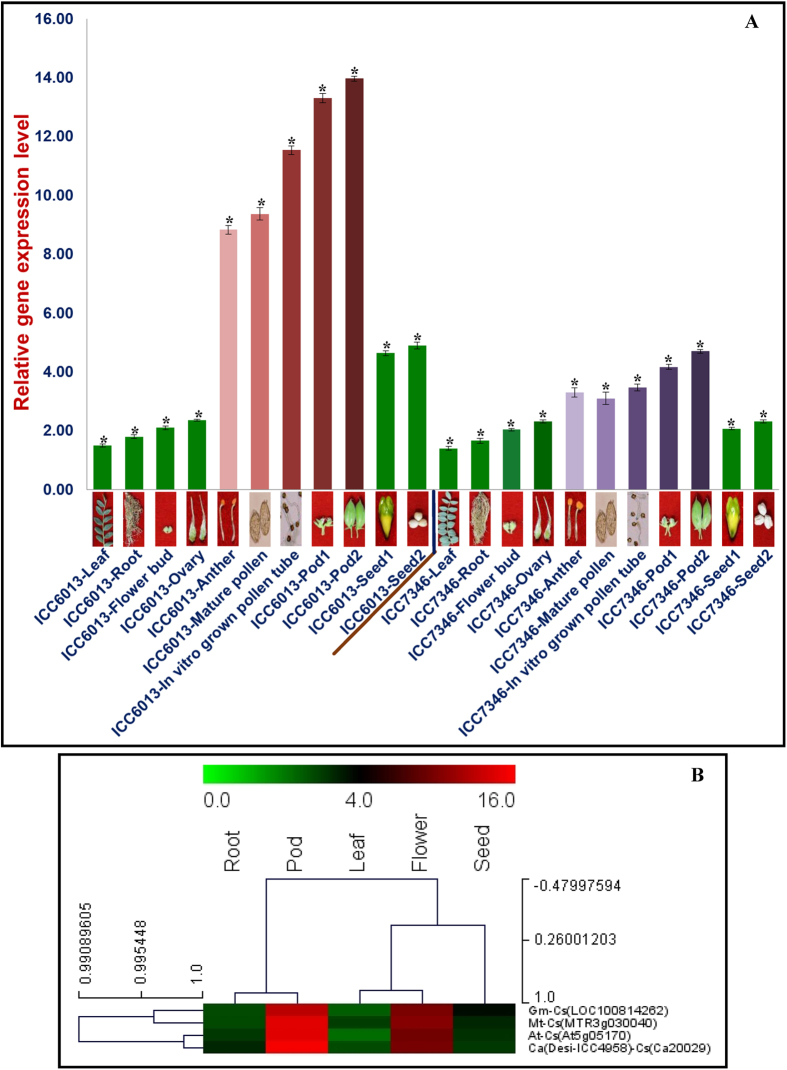
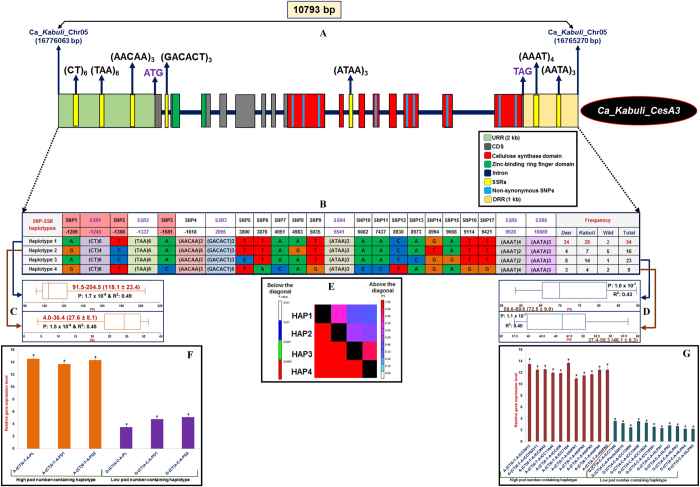
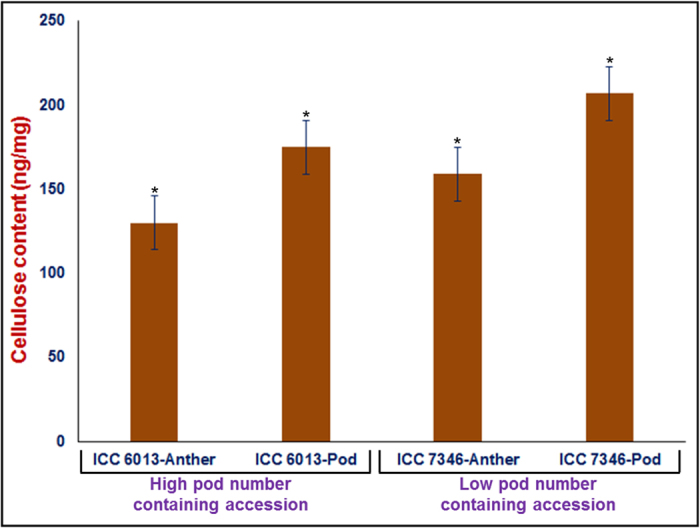
We identified 44844 high-quality SNPs by sequencing 92 diverse chickpea accessions belonging to a seed and pod trait-specific association panel using reference genome- and de novo-based GBS (genotyping-by-sequencing) assays. A GWAS (genome-wide association study) in an association panel of 211, including the 92 sequenced accessions, identified 22 major genomic loci showing significant association (explaining 23-47% phenotypic variation) with pod and seed number/plant and 100-seed weight. Eighteen trait-regulatory major genomic loci underlying 13 robust QTLs were validated and mapped on an intra-specific genetic linkage map by QTL mapping. A combinatorial approach of GWAS, QTL mapping and gene haplotype-specific LD mapping and transcript profiling uncovered one superior haplotype and favourable natural allelic variants in the upstream regulatory region of a CesA-type cellulose synthase (Ca_Kabuli_CesA3) gene regulating high pod and seed number/plant (explaining 47% phenotypic variation) in chickpea. The up-regulation of this superior gene haplotype correlated with increased transcript expression of Ca_Kabuli_CesA3 gene in the pollen and pod of high pod/seed number accession, resulting in higher cellulose accumulation for normal pollen and pollen tube growth. A rapid combinatorial genome-wide SNP genotyping-based approach has potential to dissect complex quantitative agronomic traits and delineate trait-regulatory genomic loci (candidate genes) for genetic enhancement in crop plants, including chickpea.


Conflict of interest statement

The authors declare no competing financial interests.

Figures

Figure 1
Figure 1. Unrooted phylogenetic tree depicting the genetic relations among 92 desi and kabuli chickpea accessions belonging to a seed and pod trait-specific association panel based on Nei’s genetic distance using 44844 high-quality GBS-based SNPs (MAF ≥ 0.05).
Molecular classification differentiated these accessions into three different clusters/populations (POP I, POP II and POP III) as expected based on their cultivar/species-specific origination.
Figure 2
Figure 2. Principal component analysis (PCA) differentiating the 92 desi and kabuli chickpea accessions belonging to an association panel into three populations (POP I, POP II and POP III as determined by population genetic structure) for GWAS.
The PC 1 and PC 2 explained 31.7% and 12.8% of the total variance, respectively.
Figure 3
Figure 3. LD decay (mean r2) measured in a seed and pod trait-specific association panel (92 chickpea accessions) using 6063 and 14115 SNPs physically mapped on eight desi and kabuli chromosomes, respectively.
The plotted curved lines illustrate the average r2 values among SNP loci spaced with uniform 50 kb physical intervals from 0 to 1000 kb.
Figure 4
Figure 4. Boxplots showing the differences in three seed and pod yield-contributing traits (SW, PN and SN) among three populations (POP I, POP II and POP III) as defined by population structure.
Box edges represent the upper and lower quantile with median value in the middle of the box.
Figure 5
Figure 5. Quantile-quantile plots showing the comparison between expected and observed -log10 P-values with FDR cut-off <0.05 for identifying significant genomic loci associated with three agronomic traits (PN, SN and SW).
The plots of each seed and pod yield-contributing traits among 92 chickpea accessions (association panel) were generated individually using 20439 desi (A, B and C) and 24405 kabuli (D, E and F) SNPs.
Figure 6
Figure 6. GWAS showing significant P-values (estimated integrating GLM, MLM, EMMA and CMLM) associated with three seed and pod yield-contributing traits (PN, SN and SW) using 20439 desi (A, B and C) and 24405 kabuli (D, E and F) SNPs (MAF ≥ 0.05).
The x-axis indicates the relative density of identified reference genome- and de novo-based SNPs physically mapped on eight chromosomes and scaffolds of desi and kabuli. The y-axis represents the -log10 P-value for significant association with traits. The SNPs with P values ≤ 1x10⁻⁶ showing strong trait association are demarcated with lines. The SNPs with P-values ≤ 10−4 are considered significant for trait association.
Figure 7
Figure 7. Fifteen major genomic regions harbouring 18 significant QTLs (PVE 13.6-28.7%) associated with three seed and pod yield-contributing traits (PN, SN and SW) identified and mapped on eight LGs (with a significant LOD score of >5.1; p <0.05) using a 283 F4 mapping population (ICC 6013 x ICC 7346).
The genetic distance (cM) and identity of the marker loci integrated on the LGs are indicated on the left and right side of the chromosomes, respectively. Eighteen major genomic loci underlying 13 robust QTLs showed strong association with PN, SN and SW traits based on GWAS are highlighted with yellow. Brown, green and violet lines indicate the QTLs regulating PN, SN and SW mapped on eight LGs, respectively. The directions of QTLs (additive effects) are designated with filled (ICC 6013-specific alleles) vs. empty (ICC 7346-specific alleles) boxes. qPN1.1 (QTL for pod number on chromosome 1 number 1), qSN2.1 (QTL for seed number on chromosome 2 number 1) and qSW3.1 (QTL for seed weight on chromosome 3 number 1). *qPN5.1, qPN8.1 and qSW3.1 correspond to known QTLs (TA103, TS45 and TA53 SSR markers flanking/linked to QTLs) from early reports by Radhika et al.; Gowda et al.; Varshney et al..
Figure 8
Figure 8
(A) Differential expression profiling of a strong PN- and SN-associated cellulose synthase gene in seven different vegetative (leaf and root) and reproductive (flower bud, ovary, anther, mature pollen and in vitro grown pollen tube) tissues as well as two pod and seed developmental stages of high (ICC 6013) and low (ICC 7346) pod and seed number-containing chickpea accessions using semi-quantitative and quantitative RT-PCR assays. The elongation factor-1 alpha gene was used as the internal control in the RT-PCR. The bars indicate the standard error. *Significance at p ≤ 0.01. (B) Hierarchical cluster display representing the differential expression profile of a strong PN- and SN-associated cellulose synthase gene (validated by GWAS and QTL mapping) determined by comparative global in silico digital transcript profiling. For digital transcript profiling, the whole-genome microarray expression and global transcriptome sequencing data available previously for a similar cellulose synthase gene in different vegetative and reproductive tissues of Arabidopsis, soybean, Medicago and chickpea were used. The colour-scale at the top represents average log signal expression values of genes in various tissues, in which green, black and red signify low, medium and high level of expression, respectively. The tissues and identities of cellulose synthase genes for which the differential expression data available in Glycine max (Gm), Medicago truncatula (Mt), Arabidopsis thaliana (At) and Cicer arietinum (Ca) are mentioned on the top and right-sides of expression map, respectively. We thankfully acknowledge DB and SB for taking this original photograph.
Figure 9
Figure 9. The gene haplotype-specific LD/association mapping and expression profiling in a strong PN- and SN trait-associated Ca_Kabuli_CesA3 gene, validating its potential for regulating pod/seed number in chickpea.
The genotyping of 91 SNPs and 7 SSRs in different coding and non-coding sequence component of cellulose synthase gene (A) among 102 accessions (92 association panel and 10 wild accessions) constituted four haplotypes (B). The two-specific haplotypes, haplotype 1: [A-(CT)6-T-A] and haplotype 2: [G-(CT)4-C-A], which were determined by three SNPs (−1209, −1308 and −1581 bp) and one SSR (−1245 bp) in the URR of gene showed strong association potential for high and low pod number differentiation, respectively (C). The four haplotype marker-based genotyping information produced greater LD estimates (r2 > 0.70 with P < 1.4 × 10−4) covering the entire 10793 bp sequenced region of the gene (D). The differential up-regulated expression of one high pod number-regulating superior haplotype in the URR of a Ca_Kabuli_CesA3 gene was evident in mature pollen and two pod developmental stages of high pod number-containing accessions (E), homozygous mapping individuals and parental accession (ICC 6013) compared with that of low pod number accessions. HHPN: homozygous high pod number and HLPN: homozygous low pod number.
Figure 10
Figure 10. Cellulose content estimated in the anthers with mature pollen and young pods of high (ICC 6013) and low (ICC 7346) pod number-containing chickpea accessions.
The bar indicates the standard error. *ANOVA significance at p < 0.001.

References

    1. Cho S. et al. Mapping genes for double podding and other morphological traits in chickpea. Euphytica 125, 285–292 (2002).
    1. Rakshit S. et al. DAF marker tightly linked to a major locus for Ascochyta blight resistance in chickpea (Cicer arietinum L.). Euphytica 132, 23–30 (2003).
    1. Bajaj D. et al. A combinatorial approach of comprehensive QTL-based comparative genome mapping and transcript profiling identified a seed weight-regulating candidate gene in chickpea. Sci. Rep. 5, 9264; doi:10.1038/srep09264 (2015). - DOI - PMC - PubMed
    1. Sharma K. D., Winter P., Kahl G. & Muehlbauer F. J. Molecular mapping of Fusarium oxysporum f. sp. ciceris race 3 resistance gene in chickpea. Theor. Appl. Genet. 108, 1243–1248 (2004). - PubMed
    1. Sharma K. D., Chen W. & Muehlbauer F. J. Genetics of chickpea resistance to five races of Fusarium wilt and a concise set of race differentials for Fusarium oxysporum f.sp. ciceris. Plant Dis. 89, 385–390 (2005). - PubMed

Publication types