. 2016 Feb;29(2):137-43.
doi: 10.1002/nbm.3312. Epub 2015 Jun 9.

Quantitative sodium MRI of the human brain at 9.4 T provides assessment of tissue sodium concentration and cell volume fraction during normal aging

Affiliations

Quantitative sodium MRI of the human brain at 9.4 T provides assessment of tissue sodium concentration and cell volume fraction during normal aging

Keith Thulborn et al. NMR Biomed. 2016 Feb.

Abstract

Sodium ion homeostasis is a fundamental property of viable tissue, allowing the tissue sodium concentration to be modeled as the tissue cell volume fraction. The modern neuropathology literature using ex vivo tissue from selected brain regions indicates that human brain cell density remains constant during normal aging and attributes the volume loss that occurs with advancing age to changes in neuronal size and dendritic arborization. Quantitative sodium MRI performed with the enhanced sensitivity of ultrahigh-field 9.4 T has been used to investigate tissue cell volume fraction during normal aging. This cross-sectional study (n = 49; 21-80 years) finds that the in vivo tissue cell volume fraction remains constant in all regions of the brain with advancing age in individuals who remain cognitively normal, extending the ex vivo literature reporting constant neuronal cell density across the normal adult age range. Cell volume fraction, as measured by quantitative sodium MRI, is decreased in diseases of cell loss, such as stroke, on a time scale of minutes to hours, and in response to treatment of brain tumors on a time scale of days to weeks. Neurodegenerative diseases often have prodromal periods of decades in which regional neuronal cell loss occurs prior to clinical presentation. If tissue cell volume fraction can detect such early pathology, this quantitative parameter may permit the objective measurement of preclinical disease progression. This current study in cognitively normal aging individuals provides the basis for the pursuance of investigations directed towards such neurodegenerative diseases.

Keywords: MRI; ageing; brain; cognition; human; normal; quantitative; sodium.


Figures

Figure 1
Figure 1
a. (left) Tissue cell volume fraction CVF averaged over the whole brain as a function of subject age for cognitively normal adult subjects (N=49). The CVF shows a highly conserved mean value with a small variance (0.817±0.013, r=0.126, p=0.388). Specific brain regions with correlation coefficients indicating no age dependence are tabulated in Table II. All measurements were made at 9.4T. a. (right) Tissue sodium concentration TSC (right), averaged over the whole brain as a function of subject age for cognitively normal adult subjects (N=49). The TSC shows a highly conserved mean value with a small variance (36.3±1.7, r=0.126, p=0.388). Specific brain regions with correlation coefficients indicating no age dependence are tabulated in Table II. All measurements were made at 9.4T. b. CSF space (% of calvarial volume) is plotted as a function of increasing age showing significantly (r=0.8, p< 0.001) increasing volume loss with age. All measurements were made at 9.4T.
Figure 1
Figure 1
a. (left) Tissue cell volume fraction CVF averaged over the whole brain as a function of subject age for cognitively normal adult subjects (N=49). The CVF shows a highly conserved mean value with a small variance (0.817±0.013, r=0.126, p=0.388). Specific brain regions with correlation coefficients indicating no age dependence are tabulated in Table II. All measurements were made at 9.4T. a. (right) Tissue sodium concentration TSC (right), averaged over the whole brain as a function of subject age for cognitively normal adult subjects (N=49). The TSC shows a highly conserved mean value with a small variance (36.3±1.7, r=0.126, p=0.388). Specific brain regions with correlation coefficients indicating no age dependence are tabulated in Table II. All measurements were made at 9.4T. b. CSF space (% of calvarial volume) is plotted as a function of increasing age showing significantly (r=0.8, p< 0.001) increasing volume loss with age. All measurements were made at 9.4T.
Figure 2
Figure 2
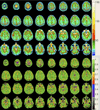
a. Representative sodium bioscales for a young adult (24 years) with axial TSC maps (superior 4 rows) with TSC color scale from 0 to 150mM and corresponding CVF maps (lower 4 rows) with the CVF color scale from 0 to 1. All measurements were made at 9.4T. b. Representative sodium bioscales for an elderly adult (73 years) with axial TSC maps (superior 4 rows) with TSC color scale from 0 to 150mM and corresponding CVF maps (lower 4 rows) with the CVF color scale from 0 to 1. The CSF space is greater in the elderly subject but the brain tissue remains green indicating similar tissue cell volume fraction. All measurements were made at 9.4T.
Figure 2
Figure 2
a. Representative sodium bioscales for a young adult (24 years) with axial TSC maps (superior 4 rows) with TSC color scale from 0 to 150mM and corresponding CVF maps (lower 4 rows) with the CVF color scale from 0 to 1. All measurements were made at 9.4T. b. Representative sodium bioscales for an elderly adult (73 years) with axial TSC maps (superior 4 rows) with TSC color scale from 0 to 150mM and corresponding CVF maps (lower 4 rows) with the CVF color scale from 0 to 1. The CSF space is greater in the elderly subject but the brain tissue remains green indicating similar tissue cell volume fraction. All measurements were made at 9.4T.

References

    1. Haug H, Eggers R. Morphometry of the human cortex cerebri and corpus striatum during aging. Neurobiol Aging. 1991;12(4):336–338. - PubMed
    1. Resnick SM, Pham DL, Kraut MA, Zonderman AB, Davatzikos C. Longitudinal magnetic resonance imaging studies of older adults: a shrinking brain. J Neurosci. 2003;23(8):3295–3301. - PMC - PubMed
    1. Burke SN, Barnes CA. Neural plasticity in the ageing brain. Nat Rev Neurosci. 2006;7:30–40. - PubMed
    1. Schmitz C, Hof PR. Design-Based Stereology in Brain Aging Research. Chapter 4. In: David R, editor. Brain Aging: Models, Methods, and Mechanisms. Boca Raton FL: Riddle, CRC Press Taylor & Francis Group; 2007. pp. 63–96. - PubMed
    1. Pakkenberg B, Pelviga D, Marnera L, Bundgaarda MJ, Gundersenb HJG, Nyengaardb JR, Regeur L. Aging and the human neocortex. Exp Gerontol. 2003;38:95–99. - PubMed

Publication types

LinkOut - more resources