Meta-Analysis
. 2015 May 20;6(14):11894-909.
doi: 10.18632/oncotarget.4180.

Meta-analysis of organ-specific differences in the structure of the immune infiltrate in major malignancies

Affiliations
Meta-Analysis

Meta-analysis of organ-specific differences in the structure of the immune infiltrate in major malignancies

Gautier Stoll et al. Oncotarget. .

Abstract

Anticancer immunosurveillance is one of the major endogenous breaks of tumor progression. Here, we analyzed gene expression pattern indicative of the presence of distinct leukocyte subtypes within four cancer types (breast cancer, colorectal carcinoma, melanoma, and non-small cell lung cancer) and 20 different microarray datasets corresponding to a total of 3471 patients. Multiple metagenes reflecting the presence of such immune cell subtypes were highly reproducible across distinct cohorts. Nonetheless, there were sizable differences in the correlation patterns among such immune-relevant metagenes across distinct malignancies. The reproducibility of the correlations among immune-relevant metagenes was highest in breast cancer (followed by colorectal cancer, non-small cell lung cancer and melanoma), reflecting the fact that mammary carcinoma has an intrinsically better prognosis than the three other malignancies. Among breast cancer patients, we found that the expression of a lysosomal enzyme-related metagene centered around ASAH1 (which codes for N-acylsphingosine amidohydrolase-1, also called acid ceramidase) exhibited a higher correlation with multiple immune-relevant metagenes in patients that responded to neoadjuvant chemotherapy than in non-responders. Altogether, this meta-analysis revealed novel organ-specific features of the immune infiltrate in distinct cancer types, as well as a strategy for defining new prognostic biomarkers.

Keywords: breast cancer; colorectal carcinoma; melanoma; meta-analysis of microarrays; non-small cell lung cancer.


Conflict of interest statement

Conflicts of Interest

The authors declare no conflict of interest.

Figures

Figure 1
Figure 1. Immune metagene reproducibility
Heat maps of reproducibility p-values, for each cancer type, for each immune metagene, in each dataset. P-values are produced by reproducibility test described in Material and Methods (by definition, reproducibility in the learning dataset has a 0 p-value). Blue rectangles represent reproducible metagenes. Grey rectangles represent single-gene metagenes (in that case, reproducibility p-value always equals to 1).
Figure 2
Figure 2. Immune metagene correlations (A-E) and correlation reproducibility p-values (F), in melanoma; reproducible correlations of first dataset (G), identified by hierarchical clustering of reproducibility p-values (H)
Heat map representation of metagene correlation matrices, in the 5 datasets of melanoma transcriptome (blue rectangle corresponds to reproducible metagenes of Figure 1). A correlation reproducibility test is applied to the 5 correlation matrices, producing a matrix of p-values. Clustering of correlation reproducibility (H) allows for the identification of a sub-part of correlation matrix (yellow square), represented for the learning dataset (G).
Figure 3
Figure 3. Immune metagene correlations (A-E) and correlation reproducibility p-values (F), in colorectal cancer; reproducible correlations of first dataset (G), identified by hierarchical clustering of reproducibility p-values (H)
Heatmap representation of metagene correlation matrices, in the 5 datasets of melanoma transcriptome (blue rectangle corresponds to reproducible metagenes of Figure 1). A correlation reproducibility test is applied to the 5 correlation matrices, producing a matrix of p-values. Clustering of correlation reproducibility (H) allows identifying sub-part of correlation matrix (yellow square), represented for the learning dataset (G).
Figure 4
Figure 4. Immune metagene correlations (A-E) and correlation reproducibility p-values (F), in breast cancer; reproducible correlations of first dataset (G), identified by hierarchical clustering of reproducibility p-values (H)
Heatmap representation of metagene correlation matrices, in the 5 datasets of melanoma transcriptome (blue rectangle corresponds to reproducible metagenes of Figure 1). A correlation reproducibility test is applied to the 5 correlation matrices, producing a matrix of p-values. Clustering of correlation reproducibility (H) allows identifying sub-part of correlation matrix (yellow square), represented for the learning dataset (G).
Figure 5
Figure 5. Immune metagene correlations (A-E) and correlation reproducibility p-values (F), in lung cancer; reproducible correlations of first dataset (G), identified by hierarchical clustering of reproducibility p-values (H)
Heatmap representation of metagene correlation matrices, in the 5 datasets of melanoma transcriptome (blue rectangle corresponds to reproducible metagenes of Figure 1). A correlation reproducibility test is applied to the 5 correlation matrices. producing a matrix of p-values. Clustering of correlation reproducibility (H) allows identifying sub-part of correlation matrix (yellow square), represented for the learning dataset (G).
Figure 6
Figure 6. Global pattern of reproducible correlations and correlation reproducibility, for immune metagene correlations
A. Density plot of reproducible correlations (reproducibility p-value <10%) for each cancer type; B. Plot of densities, separated in two modes by means of the expectation–maximization algorithm; C. Box plot representation of the two modes in B; D. Box plot representation of correlation reproducibility p-values; E. t-test p-values of reproducible correlations across distinct cancer types, referring to the high modes shown in C; F. t-test p-values of reproducible correlations, comparing cancer type, referring to the low modes shown in C. Boxplots of reproducible correlations used the values of metagene correlations in the learning dataset (in Figures 2-4, A, excluding diagonal elements), for which correlation reproducibility had a p-value < 10%. Boxplots of correlation reproducibility distribution used matrices of Figures 2-5, (excluding diagonal elements).
Figure 7
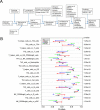
Figure 7. Variability of metagene correlations, upon treatment response in breast cancer
A. Flow chart for producing B & C. (B & C) Metagene correlations, when they are significantly different upon treatment response, B. for immune metagenes, C. for correlations between immune metagenes and ER-stress (C.1), lysosome (C.2), autophagy (C.3). Heads of arrow represent correlations for responsive tumors, tails of arrow represent correlation for non-responsive tumors. P-values were associated to the combination of correlation difference, as delineated in A. Colors represent different datasets. On the left, details of metagene are plotted, for ER-stress, lysosomes and autophagy (the name of a metagene is defined by its most representative gene).

References

    1. Denkert C, Loibl S, Noske A, Roller M, Muller BM, Komor M, Budczies J, Darb-Esfahani S, Kronenwett R, Hanusch C, von Torne C, Weichert W, Engels K, Solbach C, Schrader I, Dietel M, et al. Tumor-associated lymphocytes as an independent predictor of response to neoadjuvant chemotherapy in breast cancer. J Clin Oncol. 2010;28:105–113. - PubMed
    1. Anitei MG, Zeitoun G, Mlecnik B, Marliot F, Haicheur N, Todosi AM, Kirilovsky A, Lagorce C, Bindea G, Ferariu D, Danciu M, Bruneval P, Scripcariu V, Chevallier JM, Zinzindohoue F, Berger A, et al. Prognostic and predictive values of the immunoscore in patients with rectal cancer. Clin Cancer Res. 2014;20:1891–1899. - PubMed
    1. Galon J, Pages F, Marincola FM, Thurin M, Trinchieri G, Fox BA, Gajewski TF, Ascierto PA. The immune score as a new possible approach for the classification of cancer. J Transl Med. 2012;10:1. - PMC - PubMed
    1. Vasaturo A, Verweij D, Heinzerling L, de Vries J, Blokx W, Figdor CG. Immune infiltrates impact on the prediction of prognosis and response to immunotherapy of melanoma patients. J Transl Med. 2015;13:2080.
    1. Goc J, Fridman WH, Hammond SA, Sautes-Fridman C, Dieu-Nosjean MC. Tertiary lymphoid structures in human lung cancers, a new driver of antitumor immune responses. Oncoimmunology. 2014;3:e28976. - PMC - PubMed

Publication types