

Across language families: Genome diversity mirrors linguistic variation within Europe
- PMID: 26059462
- PMCID: PMC5095809
- DOI: 10.1002/ajpa.22758
Across language families: Genome diversity mirrors linguistic variation within Europe
Abstract
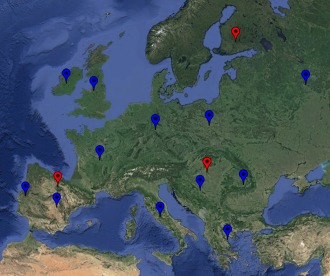
Objectives: The notion that patterns of linguistic and biological variation may cast light on each other and on population histories dates back to Darwin's times; yet, turning this intuition into a proper research program has met with serious methodological difficulties, especially affecting language comparisons. This article takes advantage of two new tools of comparative linguistics: a refined list of Indo-European cognate words, and a novel method of language comparison estimating linguistic diversity from a universal inventory of grammatical polymorphisms, and hence enabling comparison even across different families. We corroborated the method and used it to compare patterns of linguistic and genomic variation in Europe.
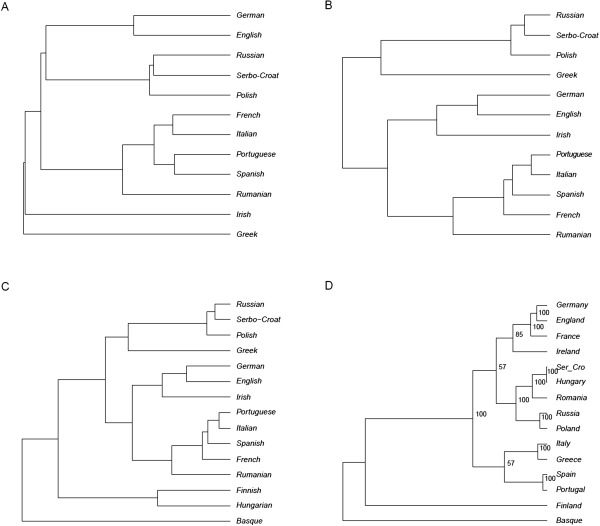
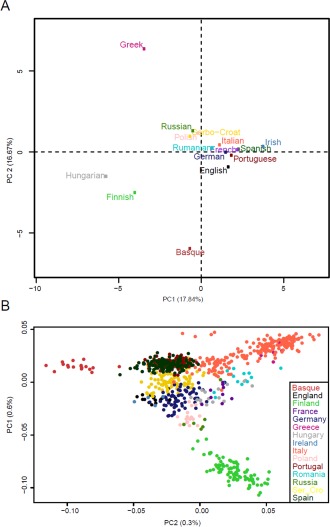
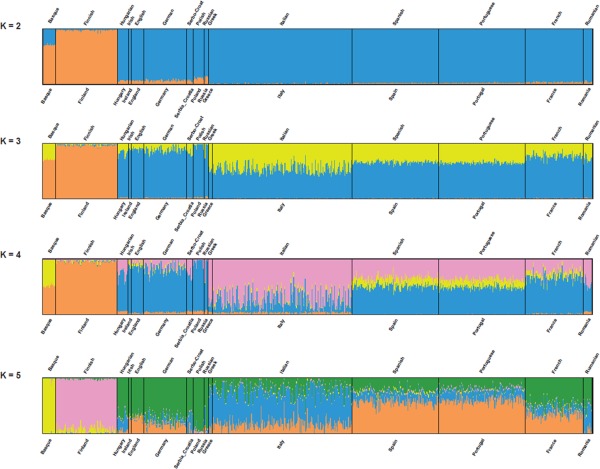
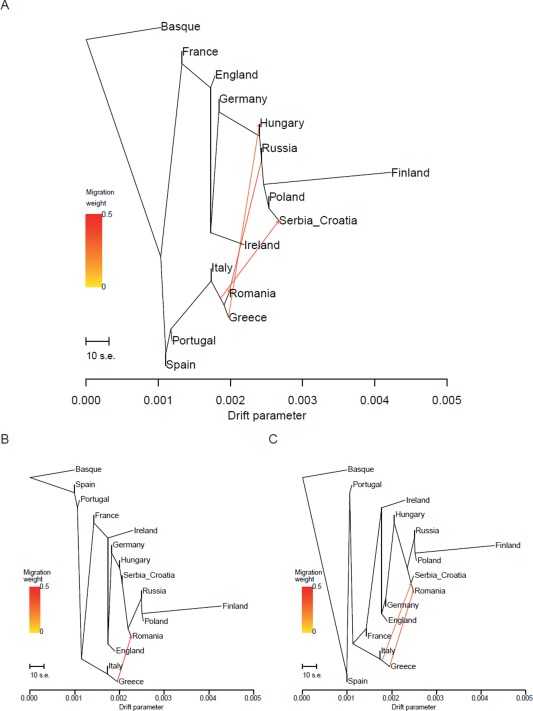
Materials and methods: Two sets of linguistic distances, lexical and syntactic, were inferred from these data and compared with measures of geographic and genomic distance through a series of matrix correlation tests. Linguistic and genomic trees were also estimated and compared. A method (Treemix) was used to infer migration episodes after the main population splits.
Results: We observed significant correlations between genomic and linguistic diversity, the latter inferred from data on both Indo-European and non-Indo-European languages. Contrary to previous observations, on the European scale, language proved a better predictor of genomic differences than geography. Inferred episodes of genetic admixture following the main population splits found convincing correlates also in the linguistic realm.
Discussion: These results pave the ground for previously unfeasible cross-disciplinary analyses at the worldwide scale, encompassing populations of distant language families.
Keywords: genome-wide diversity; human evolutionary history; parametric comparison method; single-nucleotide polymorphisms.
© 2015 Wiley Periodicals, Inc.
Figures
Similar articles
-
Long-range comparison between genes and languages based on syntactic distances.Hum Hered. 2010;70(4):245-54. doi: 10.1159/000317374. Epub 2010 Oct 14. Hum Hered. 2010. PMID: 20948220
-
Origins of Indo-Europeans and the spread of agriculture in Europe: comparison of lexicostatistical and genetic evidence.Hum Biol. 1995 Aug;67(4):577-94. Hum Biol. 1995. PMID: 7649532
-
Genetic and linguistic histories in Central Asia inferred using approximate Bayesian computations.Proc Biol Sci. 2017 Aug 30;284(1861):20170706. doi: 10.1098/rspb.2017.0706. Proc Biol Sci. 2017. PMID: 28835553 Free PMC article.
-
Testing hypotheses on processes of genetic and linguistic change in the Caucasus.Hum Biol. 1994 Oct;66(5):843-64. Hum Biol. 1994. PMID: 8001913 Review.
-
Structure and ancestry patterns of Ethiopians in genome-wide autosomal DNA.Hum Mol Genet. 2021 Apr 26;30(R1):R42-R48. doi: 10.1093/hmg/ddab019. Hum Mol Genet. 2021. PMID: 33547782 Free PMC article. Review.
Cited by
-
How humans transmit language: horizontal transmission matches word frequencies among peers on Twitter.J R Soc Interface. 2018 Feb;15(139):20170738. doi: 10.1098/rsif.2017.0738. J R Soc Interface. 2018. PMID: 29436508 Free PMC article.
-
Formal Syntax and Deep History.Front Psychol. 2020 Dec 18;11:488871. doi: 10.3389/fpsyg.2020.488871. eCollection 2020. Front Psychol. 2020. PMID: 33391062 Free PMC article.
-
Genetic Reconstruction and Forensic Analysis of Chinese Shandong and Yunnan Han Populations by Co-Analyzing Y Chromosomal STRs and SNPs.Genes (Basel). 2020 Jul 3;11(7):743. doi: 10.3390/genes11070743. Genes (Basel). 2020. PMID: 32635262 Free PMC article.
-
A multicenter case-control study of the effect of e-nos VNTR polymorphism on upper gastrointestinal hemorrhage in NSAID users.Sci Rep. 2021 Oct 7;11(1):19923. doi: 10.1038/s41598-021-99402-w. Sci Rep. 2021. PMID: 34620931 Free PMC article.
-
Synergism interaction between genetic polymorphisms in drug metabolizing enzymes and NSAIDs on upper gastrointestinal haemorrhage: a multicenter case-control study.Ann Med. 2022 Dec;54(1):379-392. doi: 10.1080/07853890.2021.2016940. Ann Med. 2022. PMID: 35114859 Free PMC article.
References
-
- Alonso S, Flores C, Cabrera V, Alonso A, Martín P, Albarrán C, Izagirre N, de la Rúa C, García O. 2005. The place of the basques in the European Y‐chromosome diversity landscape. Eur J Hum Genet 13:1293‐1302. - PubMed
-
- Baker M. 2001. The atoms of language. New York: Basic Books.
-
- Barbujani G, Colonna V. 2010. Human genome diversity: frequently asked questions. Trends Genet 26:285–295. - PubMed
Publication types
MeSH terms
LinkOut - more resources
Full Text Sources
Other Literature Sources
Research Materials
Miscellaneous
