

Measuring individual inbreeding in the age of genomics: marker-based measures are better than pedigrees
- PMID: 26059970
- PMCID: PMC4815495
- DOI: 10.1038/hdy.2015.17
Measuring individual inbreeding in the age of genomics: marker-based measures are better than pedigrees
Abstract
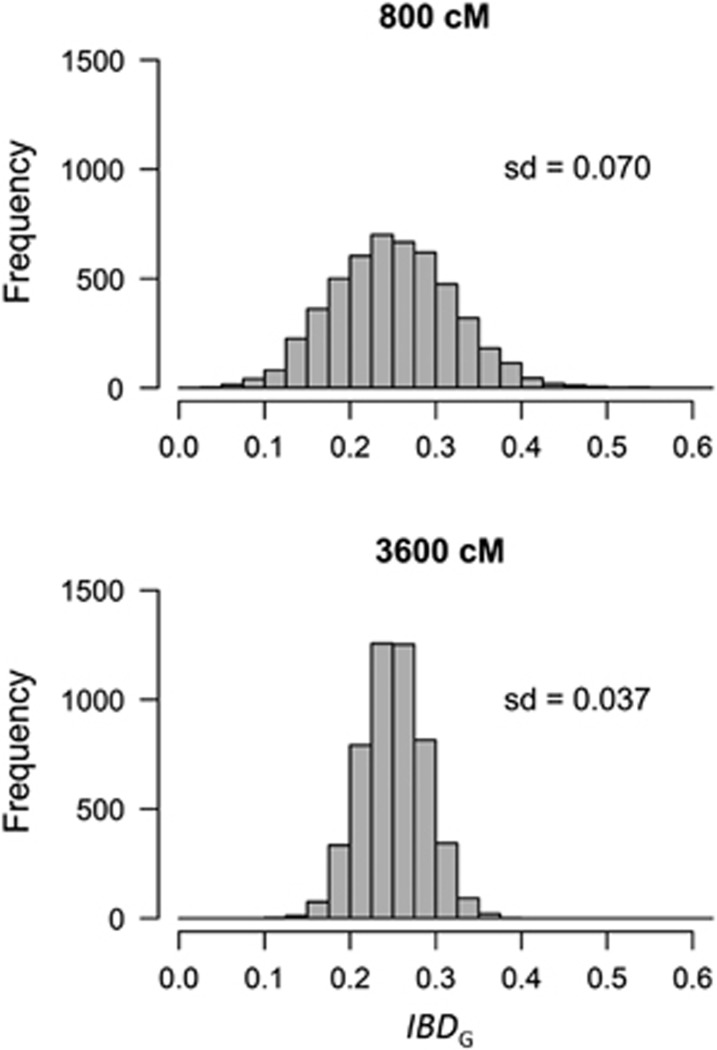
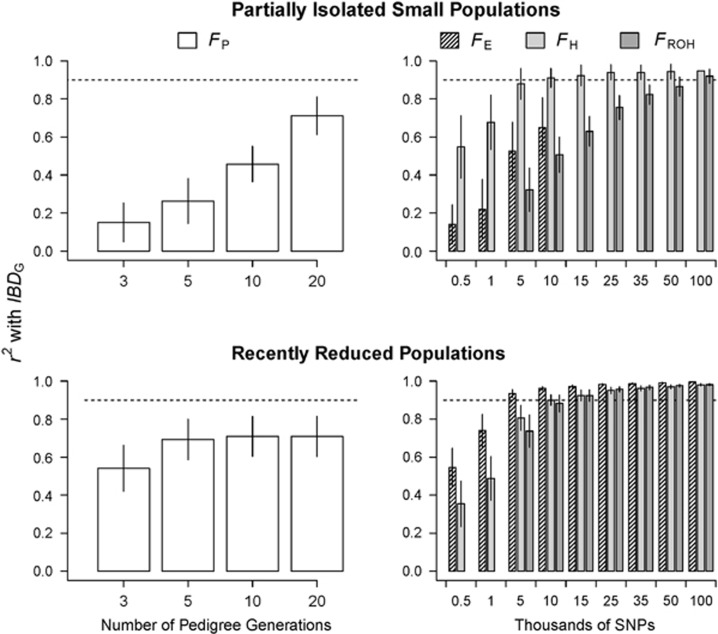
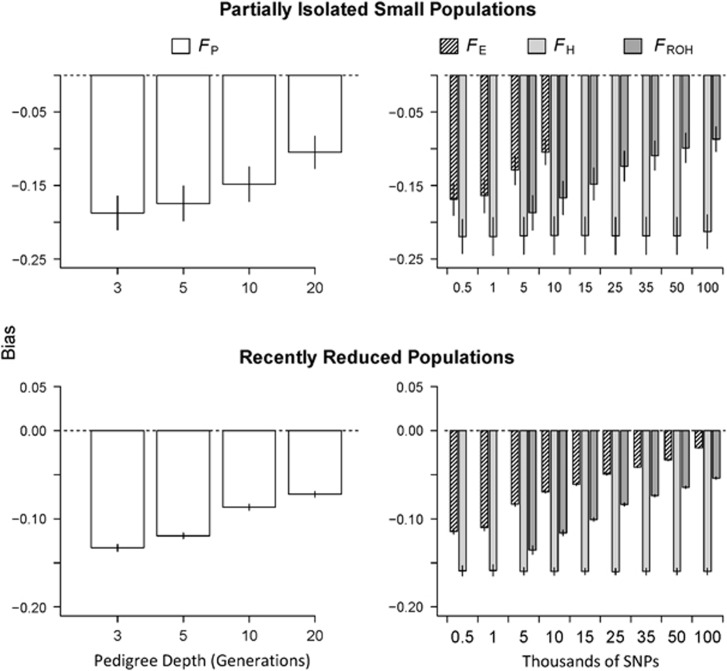
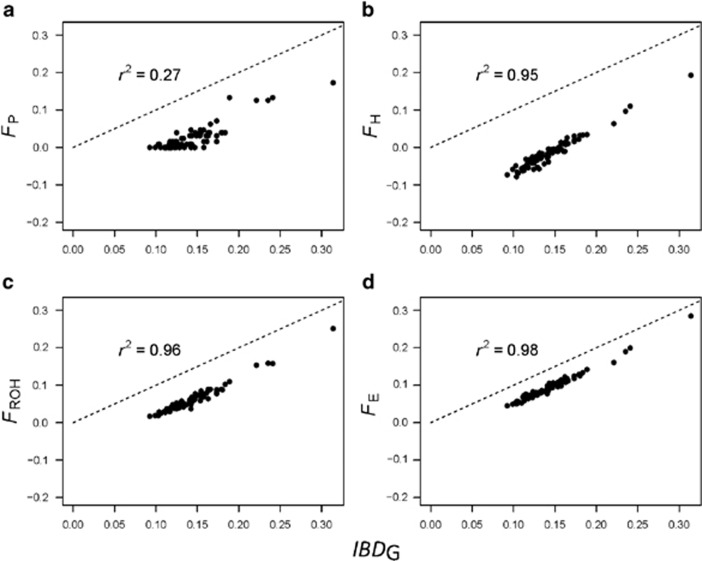
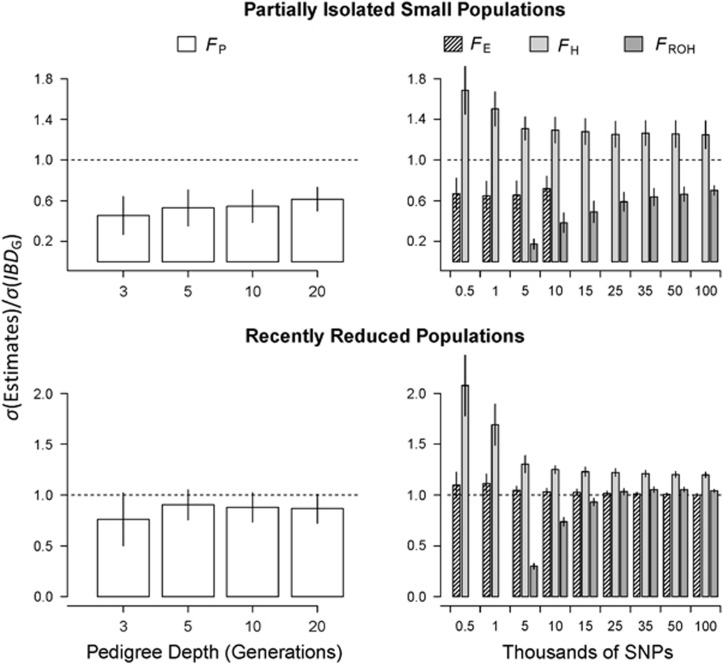
Inbreeding (mating between relatives) can dramatically reduce the fitness of offspring by causing parts of the genome to be identical by descent. Thus, measuring individual inbreeding is crucial for ecology, evolution and conservation biology. We used computer simulations to test whether the realized proportion of the genome that is identical by descent (IBDG) is predicted better by the pedigree inbreeding coefficient (FP) or by genomic (marker-based) measures of inbreeding. Genomic estimators of IBDG included the increase in individual homozygosity relative to mean Hardy-Weinberg expected homozygosity (FH), and two measures (FROH and FE) that use mapped genetic markers to estimate IBDG. IBDG was more strongly correlated with FH, FE and FROH than with FP across a broad range of simulated scenarios when thousands of SNPs were used. For example, IBDG was more strongly correlated with FROH, FH and FE (estimated with ⩾10 000 SNPs) than with FP (estimated with 20 generations of complete pedigree) in populations with a recent reduction in the effective populations size (from Ne=500 to Ne=75). FROH, FH and FE generally explained >90% of the variance in IBDG (among individuals) when 35 K or more SNPs were used. FP explained <80% of the variation in IBDG on average in all simulated scenarios, even when pedigrees included 20 generations. Our results demonstrate that IBDG can be more precisely estimated with large numbers of genetic markers than with pedigrees. We encourage researchers to adopt genomic marker-based measures of IBDG as thousands of loci can now be genotyped in any species.
Figures
References
-
- Allendorf FW, Hohenlohe PA, Luikart G. (2010). Genomics and the future of conservation genetics. Nat Rev Genet 11: 697–709. - PubMed
-
- Balloux F, Amos W, Coulson T. (2004). Does heterozygosity estimate inbreeding in real populations? Mol Ecol 13: 3021–3031. - PubMed
-
- Chapman N, Thompson E. (2003). A model for the length of tracts of identity by descent in finite random mating populations. Theor Popul Biol 64: 141–150. - PubMed
-
- Daetwyler H, Hickey J, Henshall J, Dominik S, Gredler B et al. (2010). Accuracy of estimated genomic breeding values for wool and meat traits in a multi-breed sheep population. Anim Prod Sci 50: 1004–1010.
Publication types
MeSH terms
Substances
LinkOut - more resources
Full Text Sources
Other Literature Sources
Miscellaneous
