

A survey of human brain transcriptome diversity at the single cell level
- PMID: 26060301
- PMCID: PMC4466750
- DOI: 10.1073/pnas.1507125112
A survey of human brain transcriptome diversity at the single cell level
Abstract
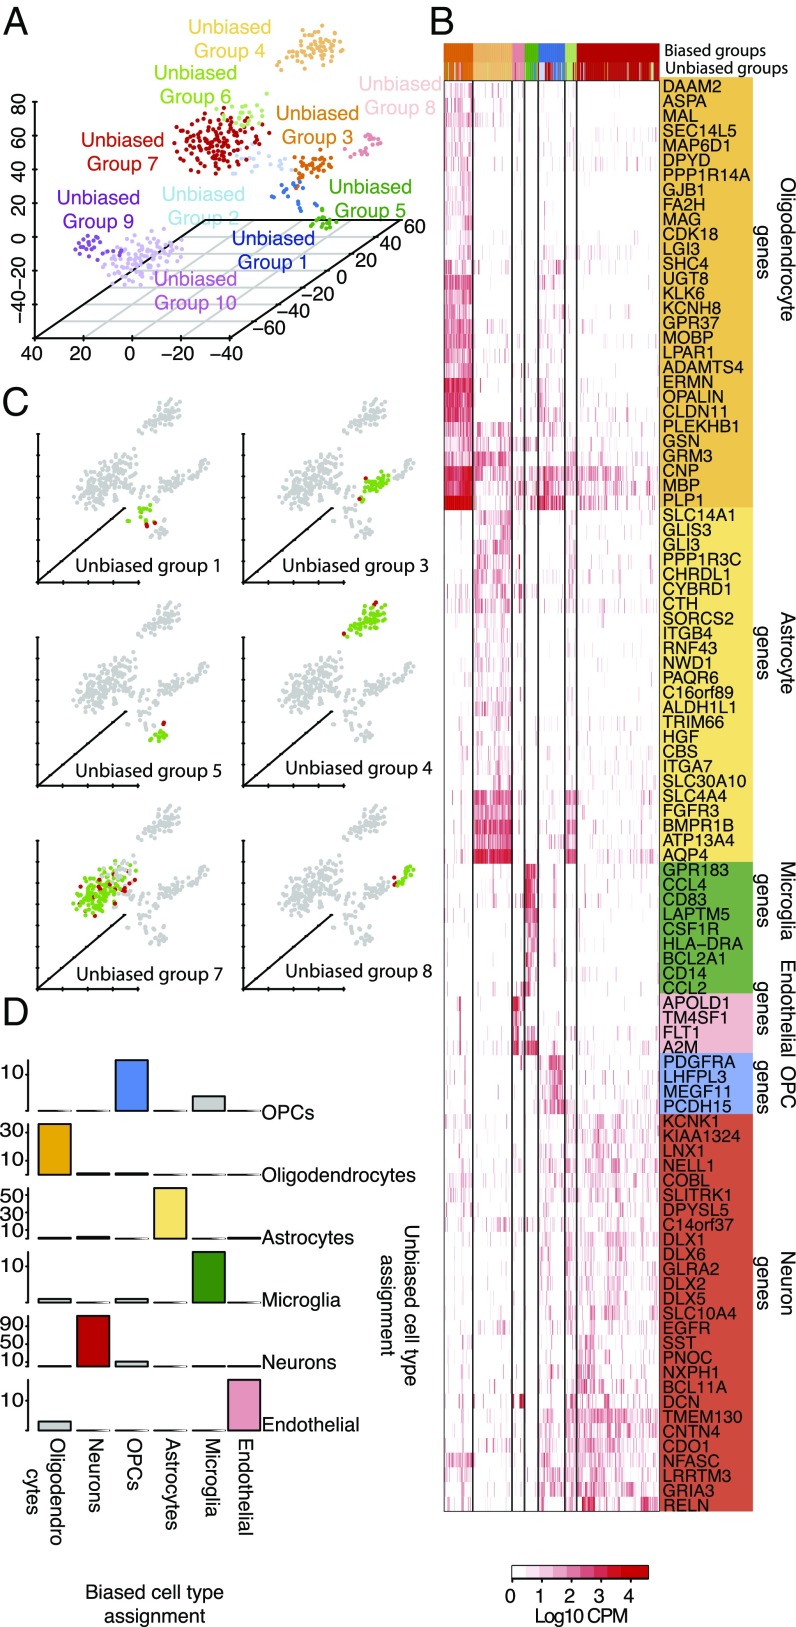
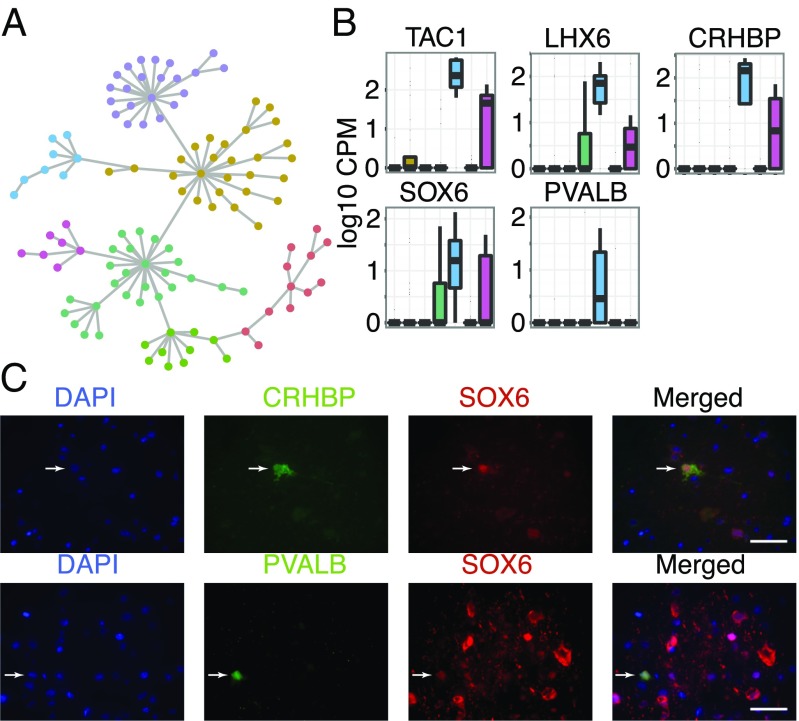
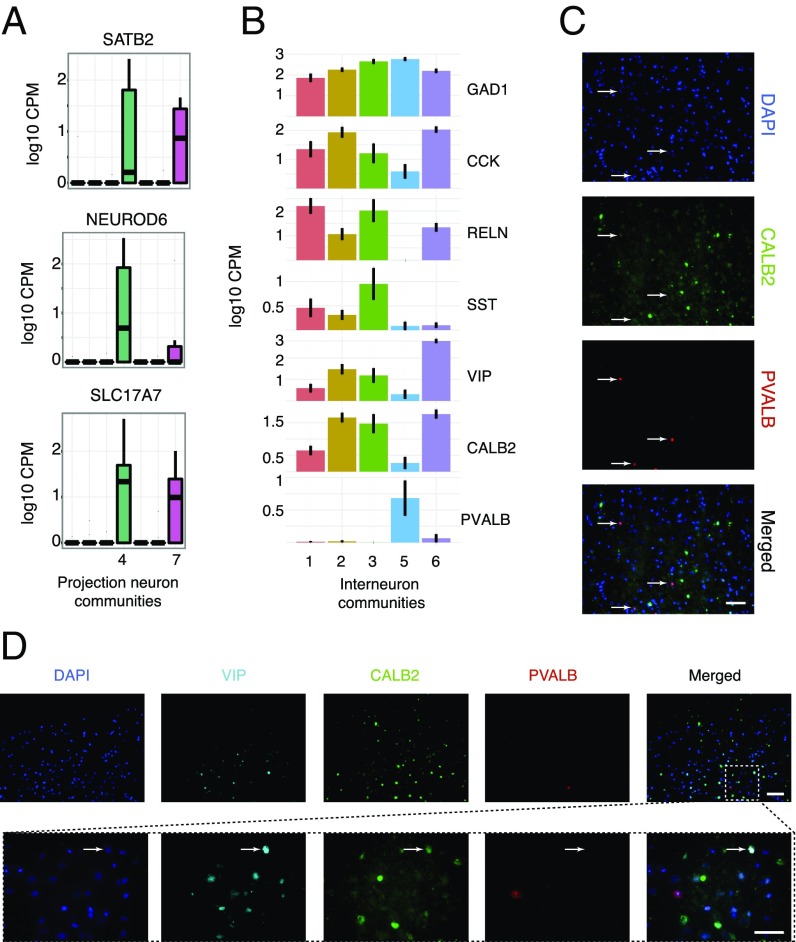
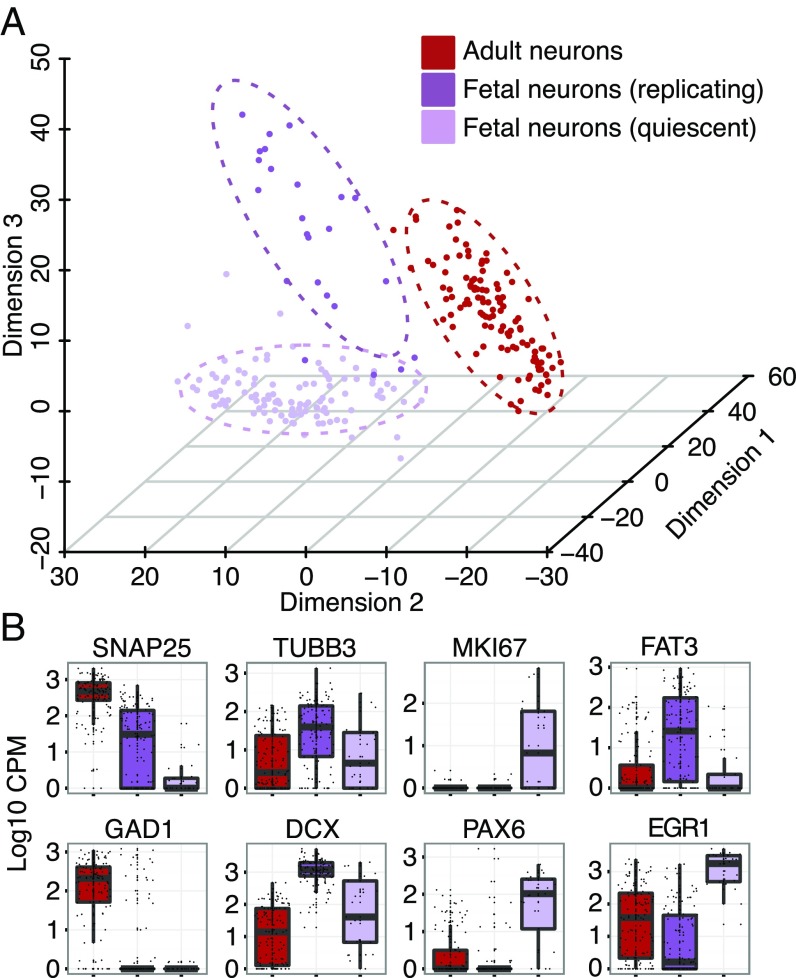
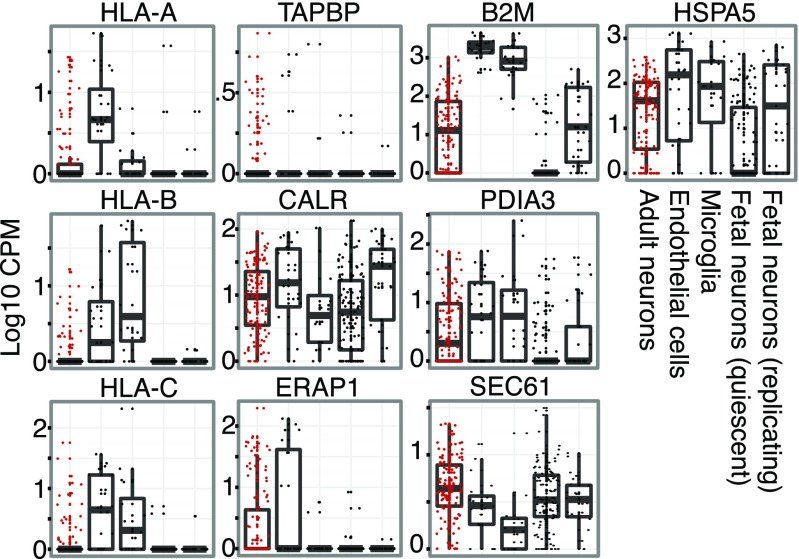
The human brain is a tissue of vast complexity in terms of the cell types it comprises. Conventional approaches to classifying cell types in the human brain at single cell resolution have been limited to exploring relatively few markers and therefore have provided a limited molecular characterization of any given cell type. We used single cell RNA sequencing on 466 cells to capture the cellular complexity of the adult and fetal human brain at a whole transcriptome level. Healthy adult temporal lobe tissue was obtained during surgical procedures where otherwise normal tissue was removed to gain access to deeper hippocampal pathology in patients with medical refractory seizures. We were able to classify individual cells into all of the major neuronal, glial, and vascular cell types in the brain. We were able to divide neurons into individual communities and show that these communities preserve the categorization of interneuron subtypes that is typically observed with the use of classic interneuron markers. We then used single cell RNA sequencing on fetal human cortical neurons to identify genes that are differentially expressed between fetal and adult neurons and those genes that display an expression gradient that reflects the transition between replicating and quiescent fetal neuronal populations. Finally, we observed the expression of major histocompatibility complex type I genes in a subset of adult neurons, but not fetal neurons. The work presented here demonstrates the applicability of single cell RNA sequencing on the study of the adult human brain and constitutes a first step toward a comprehensive cellular atlas of the human brain.
Keywords: RNAseq; human brain; interneurons; neurons; single cells.
Conflict of interest statement
S.R.Q. is a founder of and consultant for Fluidigm.
Figures
References
Publication types
MeSH terms
Substances
Associated data
- Actions
Grants and funding
- F30MH106261/MH/NIMH NIH HHS/United States
- R01MH099555/MH/NIMH NIH HHS/United States
- R01NS081703/NS/NINDS NIH HHS/United States
- U01 HL099999/HL/NHLBI NIH HHS/United States
- R00 NS089780/NS/NINDS NIH HHS/United States
- K99 NS089780/NS/NINDS NIH HHS/United States
- U01-HL099999/HL/NHLBI NIH HHS/United States
- T32GM007365/GM/NIGMS NIH HHS/United States
- HHMI/Howard Hughes Medical Institute/United States
- R01 MH099555/MH/NIMH NIH HHS/United States
- K99NS089780/NS/NINDS NIH HHS/United States
- U01-HL099995/HL/NHLBI NIH HHS/United States
- R01 NS081703/NS/NINDS NIH HHS/United States
- T32 GM007365/GM/NIGMS NIH HHS/United States
- U01 HL099995/HL/NHLBI NIH HHS/United States
- F30 MH106261/MH/NIMH NIH HHS/United States
- R01 CA216054/CA/NCI NIH HHS/United States
LinkOut - more resources
Full Text Sources
Other Literature Sources
Molecular Biology Databases
