

Contribution of Food Groups to Energy and Nutrient Intakes in Five Developed Countries
- PMID: 26061017
- PMCID: PMC4488804
- DOI: 10.3390/nu7064593
Contribution of Food Groups to Energy and Nutrient Intakes in Five Developed Countries
Abstract
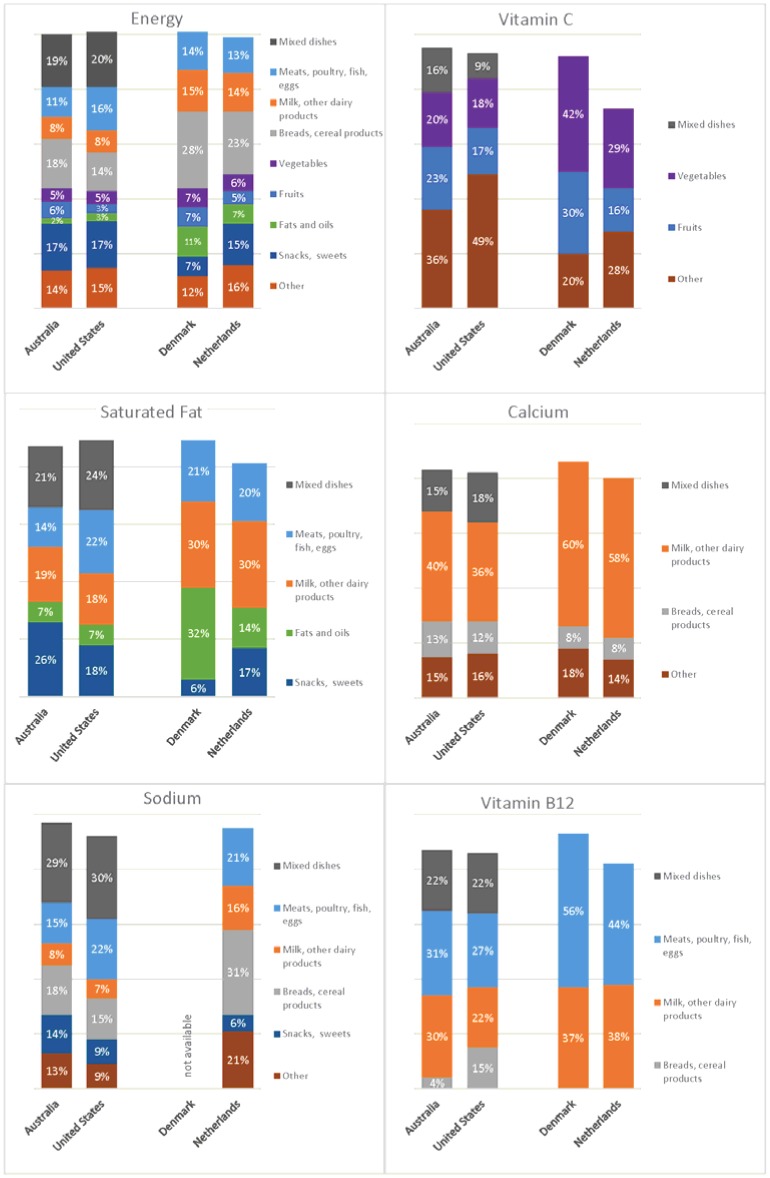
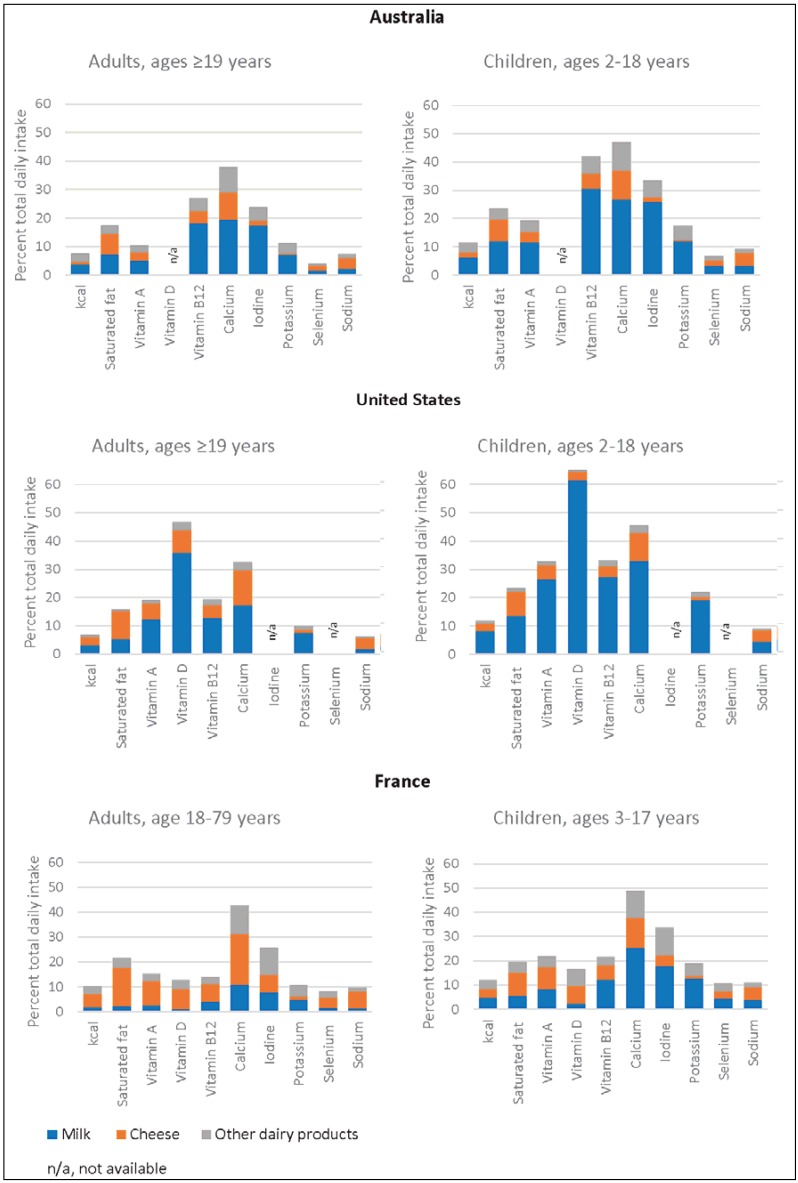
Economic growth in developing countries and globalization of the food sector is leading to increasingly similar food consumption patterns worldwide. The aim of this study was to describe similarities and differences in the contributions of main food groups to energy and nutrient intakes in five developed countries across three continents. We obtained summary reports of national food consumption survey data from Australia, France, Denmark, the Netherlands, and the United States. Survey years spanned 2003-2012; sample size ranged from 1444 to 17,386. To mitigate heterogeneity of food groups across countries, we recategorized each survey's reported food groups and subgroups into eight main food groups and, for three countries, a ninth "mixed dishes" group. We determined the percent contribution of each food group to mean daily intakes of energy, saturated fat, sodium, fiber, and ten vitamins and minerals that are commonly under-consumed. Differences in findings from surveys utilizing a foods-as-consumed versus a disaggregated or ingredients approach to food group composition and contributions from the milk and milk products group, a source of several under-consumed nutrients, were explored. Patterns of food group contributions to energy and nutrient intakes were generally similar across countries. Some differences were attributable to the analytical approach used by the surveys. For the meat/protein, milk and milk products, vegetables, and fruit groups, percent contributions to key nutrient intakes exceeded percent contributions to energy intake. The mixed dishes group provided 10%-20% of total daily energy and a similar 10%-25% of the daily intake of several nutrients. This descriptive study contributes to an understanding of food group consumption patterns in developed countries.
Keywords: nutrition guidelines; nutritional requirements; nutritional surveys; nutritive value.
Figures
References
-
- Food and Agricultural Organization (FAO) World Food Programme (WFP) International Fund for Agricultural Development (IFAD) The State of Food Insecurity in the World 2012. Economic Growth is Necessary but Not Sufficient to Accelerate Reduction of Hunger and Malnutrition. Food and Agricultural Organization; Rome, Italy: 2012. Economic growth, hunger and malnutrition. Income growth and changes in food consumption; pp. 15–27. - PubMed
-
- Frazao E., Meade B., Regmi A. Converging Patterns in Global Food Consumption and Food delivery systems. [(accessed on 11 September 2014)];USDA Amber Waves. 2008 Available online: http://www.ers.usda.gov/amber-waves/2008-february/converging-patterns-in....
-
- Health Council of the Netherlands . Guidelines for a Healthy Diet 2006. Health Council of the Netherlands; The Hague, The Netherlands: 2006. Publication No. 2006/21E, ISBN 90-5549-656-3.
-
- Health Canada . Eating Well with Canada’s Food Guide. Minister of Health; Ottawa, ON, Canada: 2007. HC Publication No. 4651.
Publication types
MeSH terms
Substances
LinkOut - more resources
Full Text Sources
Other Literature Sources
