. 2015 Jun 10;9(6):e0003756.
doi: 10.1371/journal.pntd.0003756. eCollection 2015.

Prioritising Infectious Disease Mapping

Affiliations

Prioritising Infectious Disease Mapping

David M Pigott et al. PLoS Negl Trop Dis. .

Abstract

Background: Increasing volumes of data and computational capacity afford unprecedented opportunities to scale up infectious disease (ID) mapping for public health uses. Whilst a large number of IDs show global spatial variation, comprehensive knowledge of these geographic patterns is poor. Here we use an objective method to prioritise mapping efforts to begin to address the large deficit in global disease maps currently available.

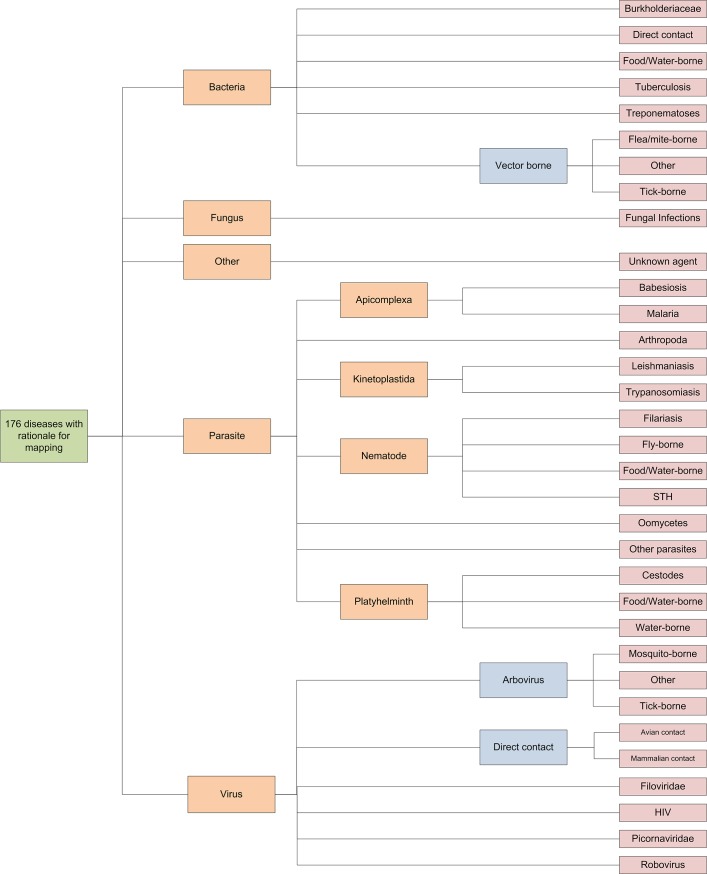
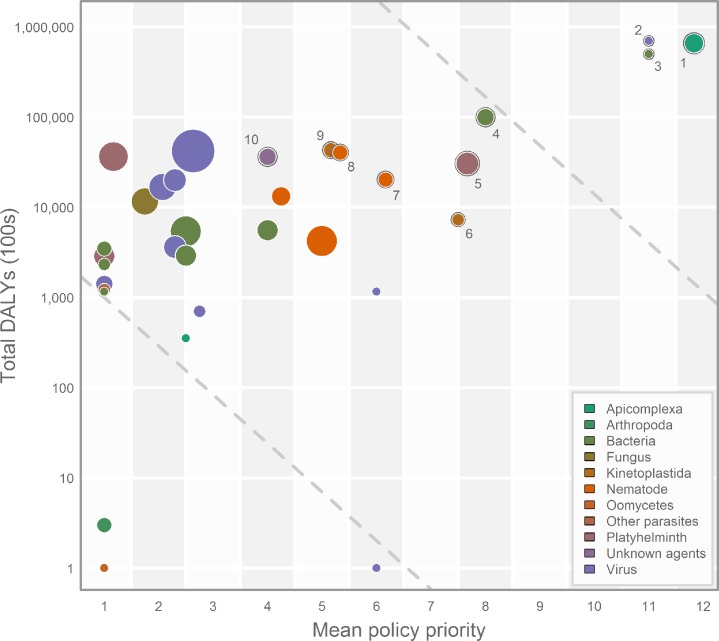
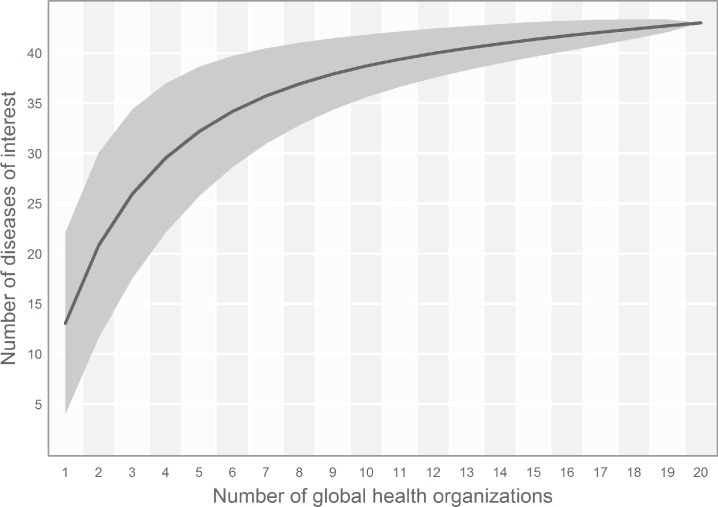
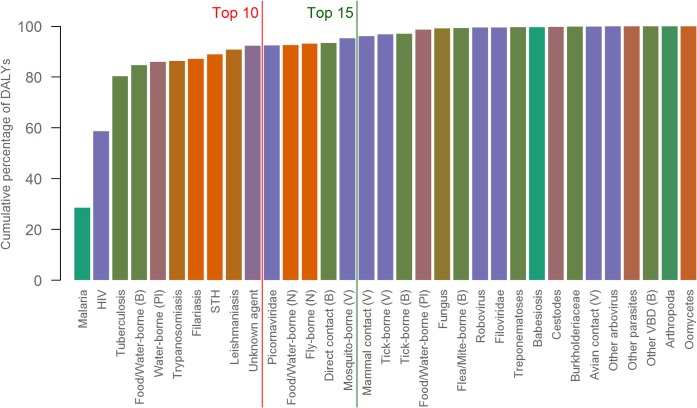
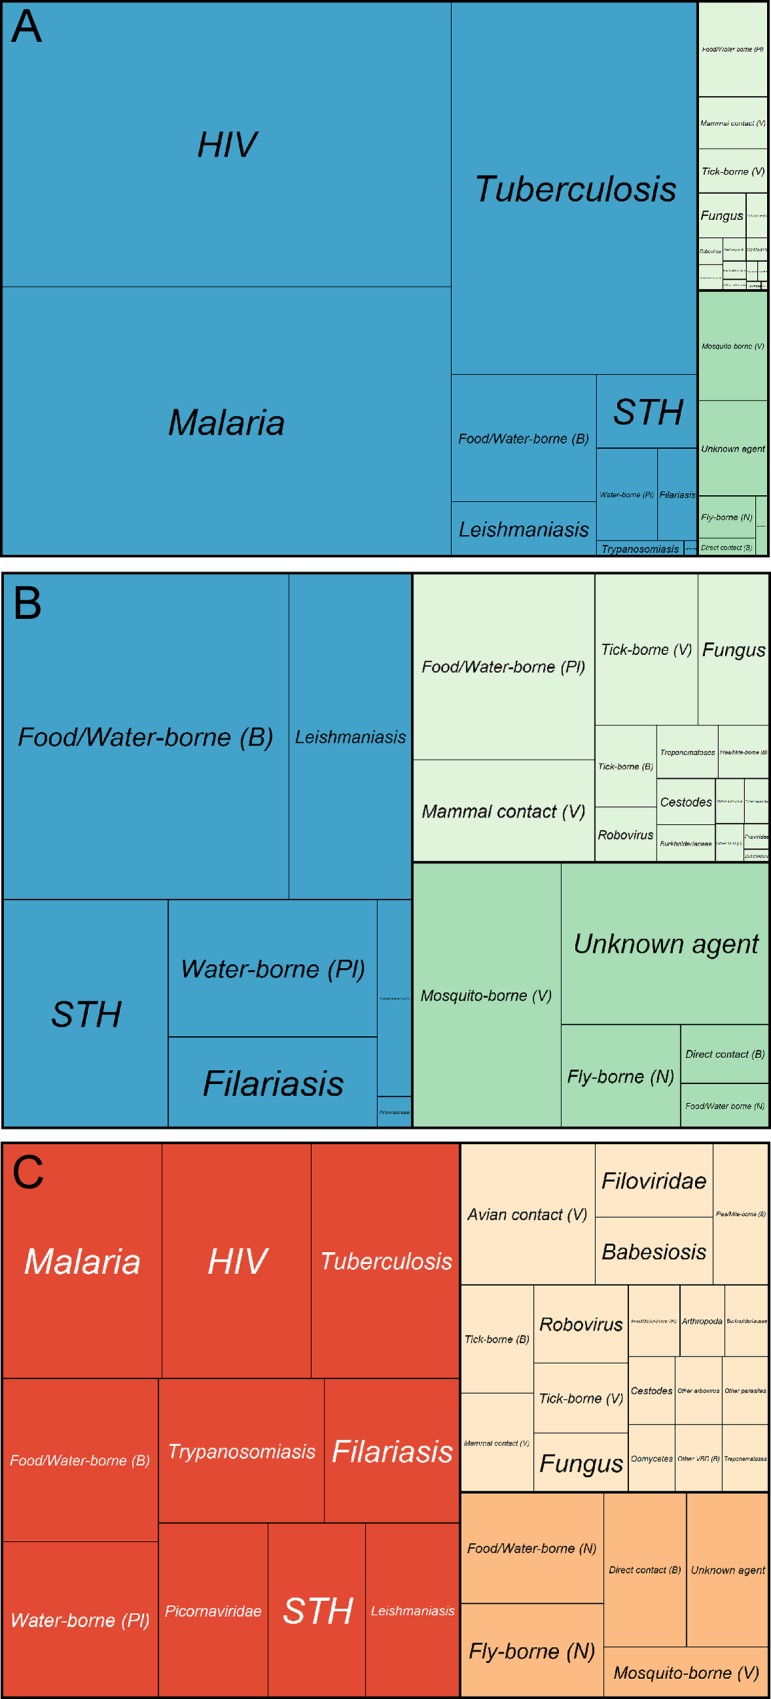
Methodology/principal findings: Automation of ID mapping requires bespoke methodological adjustments tailored to the epidemiological characteristics of different types of diseases. Diseases were therefore grouped into 33 clusters based upon taxonomic divisions and shared epidemiological characteristics. Disability-adjusted life years, derived from the Global Burden of Disease 2013 study, were used as a globally consistent metric of disease burden. A review of global health stakeholders, existing literature and national health priorities was undertaken to assess relative interest in the diseases. The clusters were ranked by combining both metrics, which identified 44 diseases of main concern within 15 principle clusters. Whilst malaria, HIV and tuberculosis were the highest priority due to their considerable burden, the high priority clusters were dominated by neglected tropical diseases and vector-borne parasites.

Conclusions/significance: A quantitative, easily-updated and flexible framework for prioritising diseases is presented here. The study identifies a possible future strategy for those diseases where significant knowledge gaps remain, as well as recognising those where global mapping programs have already made significant progress. For many conditions, potential shared epidemiological information has yet to be exploited.


Conflict of interest statement

I have read the journal's policy and the authors of this manuscript have the following competing interests: SJB is a deputy editor of PLoS Neglected Tropical Diseases.

Figures

Fig 1
Fig 1. Hierarchical organisation of the 33 clusters.
The 176 diseases with strong rationale for mapping were first sorted by taxonomy of pathogenic agent (in orange) and then structured by common epidemiological and transmission characteristics into sub-groupings (in blue) and finally clusters (in red). STH = soil transmitted helminth, VBD = vector borne disease.
Fig 2
Fig 2. Disease prioritisation.
Plot showing the 33 clusters of diseases as ranked by burden of disease DALYs (y-axis—logarithmic scale) and mean policy priority score of occurrence mapping and prevalence mapping diseases (x-axis—linear scale). The top ten clusters circled and numbered as identified in Table 1. The size of the circle is determined by the total number of diseases contained and colour is based upon taxonomy (as outlined by Fig 1; the web appendix contains the full disease listing for each cluster). The dashed guidelines are perpendicular to the axis along which prioritisation order for the clusters was determined; those closer to the top right, along this axis, were prioritised higher.
Fig 3
Fig 3. A “species accumulation” curve showing the cumulative number of diseases of interest sampled by increasing numbers of public health stakeholders examined.
The diseases of interest of twenty global health stakeholders was indexed and plotted (see Methods). As additional organisations are sampled beyond the fifteen used in this study, the number of unique diseases identified plateaus at around 42. Thus not all public health stakeholders need to be sampled to capture the global diversity of diseases of public health interest.
Fig 4
Fig 4. Cumulative percentage barplot indicating the cumulative percentage of DALYs accounted for by each cluster.
The colouring is based upon taxonomy, as in Fig 2. The red line indicates the top ten clusters, the dark green indicates the top 15.
Fig 5
Fig 5. Plots indicating the relative importance of each mapping cluster.
(A) Area of each section is determined by the total DALY contribution of each of the 33 clusters. Blue indicates a cluster contributing to the top ten clusters to be prioritised, green indicates top 44 diseases (n = 5 clusters) and light green represents the remaining disease clusters (n = 18). (B) Area of each section is determined by the total DALY contribution of 30 clusters, with HIV, tuberculosis and malaria excluded. Blue indicates a cluster contributing to the top ten clusters to be prioritised (n = 7), green indicates top 44 diseases (n = 5 clusters) and light green represents the remaining disease clusters (n = 18). STH = soil-transmitted helminth, (B)—bacteria, (N)—nematode, (Pl)—platyhelminth, (V)—virus. (C) Area of each section is determined by the total policy interest score of each of the 33 clusters. Red indicates a cluster within the top ten to be prioritised, orange indicates one of top 44 diseases (n = 5) and light pink represents the remaining disease clusters (n = 18). STH = soil-transmitted helminth, (B)—bacteria, (N)—nematode, (Pl)—platyhelminth, (V)—virus.

References

    1. Hay SI, Battle KE, Pigott DM, Smith DL, Moyes CL, et al. (2013) Global mapping of infectious disease. Philos Trans R Soc Lond B Biol Sci 368: 20120250 10.1098/rstb.2012.0250 - DOI - PMC - PubMed
    1. Brady OJ, Gething PW, Bhatt S, Messina JP, Brownstein JS, et al. (2012) Refining the global spatial limits of dengue virus transmission by evidence-based consensus. PLoS Negl Trop Dis 6: e1760 10.1371/journal.pntd.0001760 - DOI - PMC - PubMed
    1. Guerra CA, Gikandi PW, Tatem AJ, Noor AM, Smith DL, et al. (2008) The limits and intensity of Plasmodium falciparum transmission: Implications for malaria control and elimination worldwide. PLoS Med 5: 300–311. - PMC - PubMed
    1. Guerra CA, Howes RE, Patil AP, Gething PW, Van Boeckel TP, et al. (2010) The international limits and population at risk of Plasmodium vivax transmission in 2009. PLoS Negl Trop Dis 4: e774 10.1371/journal.pntd.0000774 - DOI - PMC - PubMed
    1. Pullan RL, Brooker SJ (2012) The global limits and population at risk of soil-transmitted helminth infections in 2010. Parasit Vectors 5: 81 10.1186/1756-3305-5-81 - DOI - PMC - PubMed

Publication types