. 2015 Oct;88(4):722-33.
doi: 10.1038/ki.2015.162. Epub 2015 Jun 10.

Macrophage-derived tumor necrosis factor-α mediates diabetic renal injury

Affiliations

Macrophage-derived tumor necrosis factor-α mediates diabetic renal injury

Alaa S Awad et al. Kidney Int. 2015 Oct.

Abstract

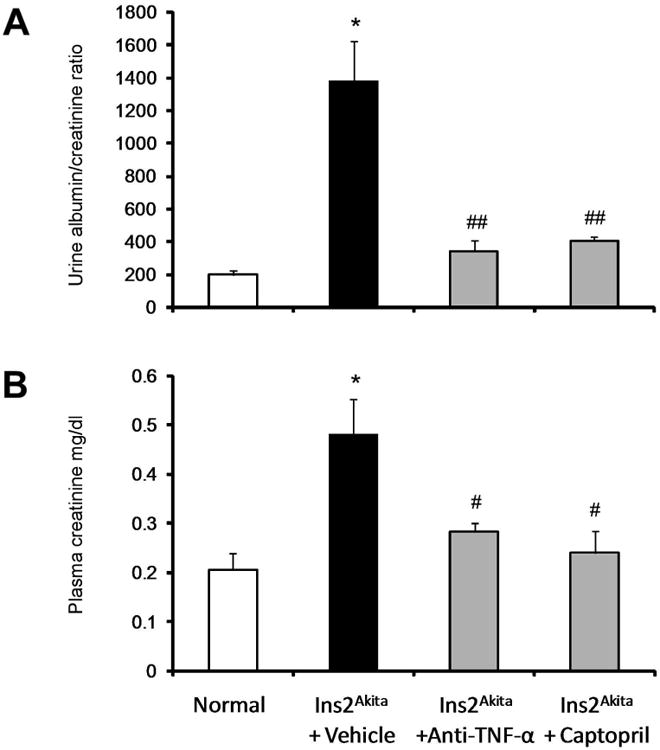
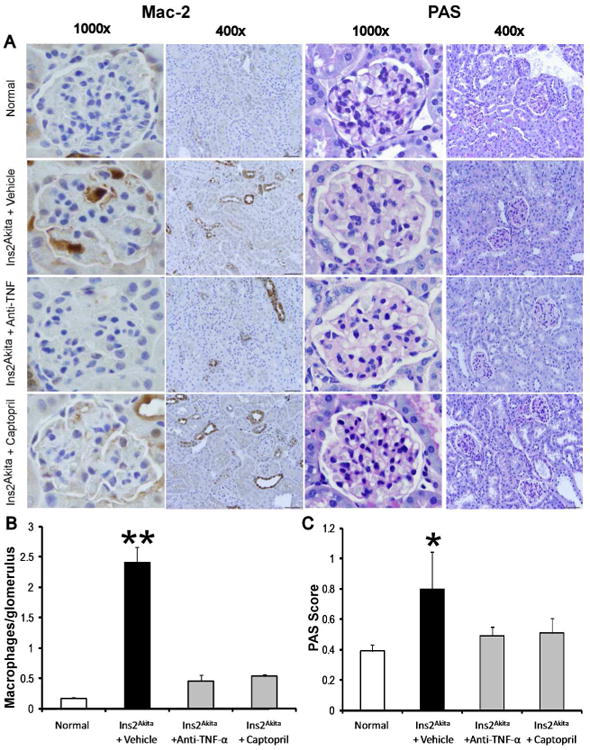
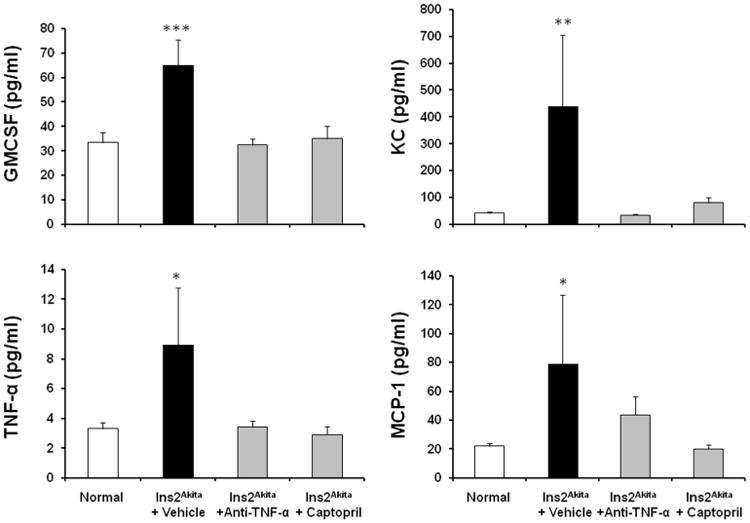
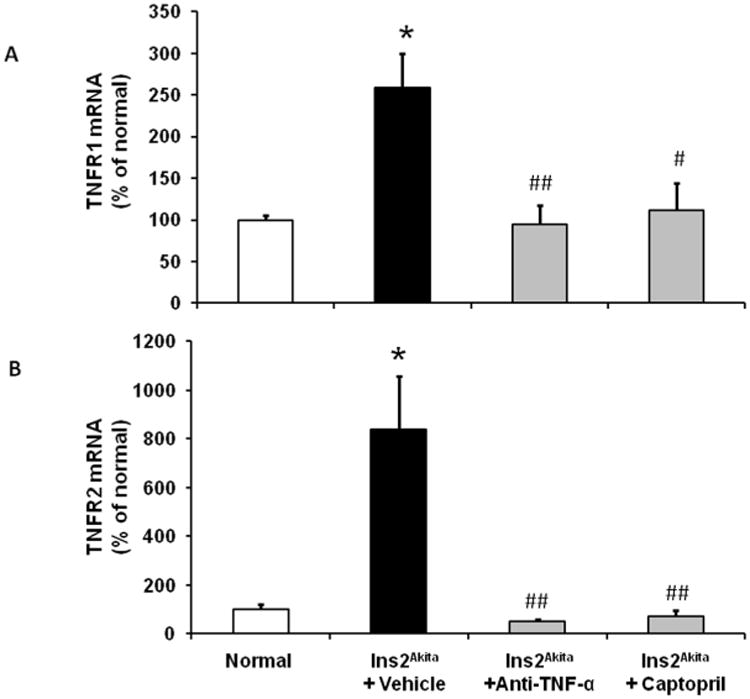
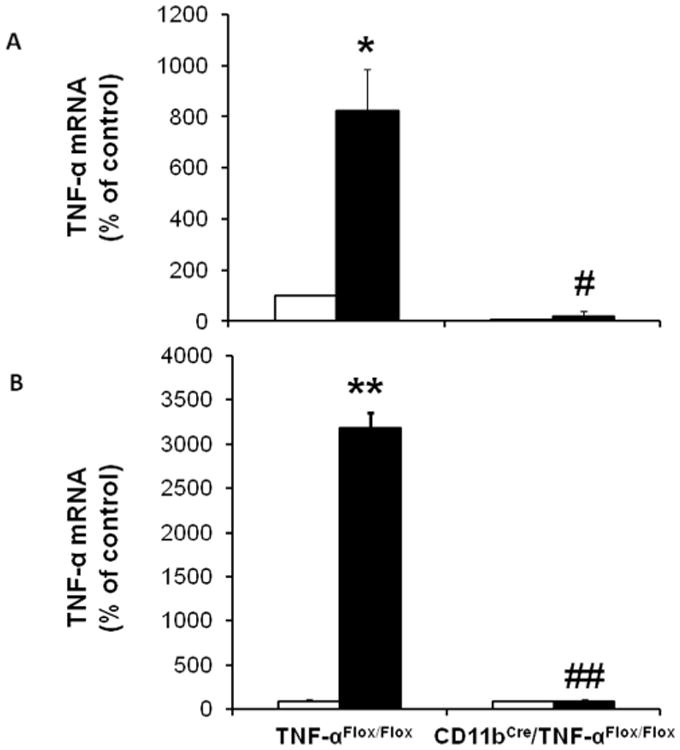
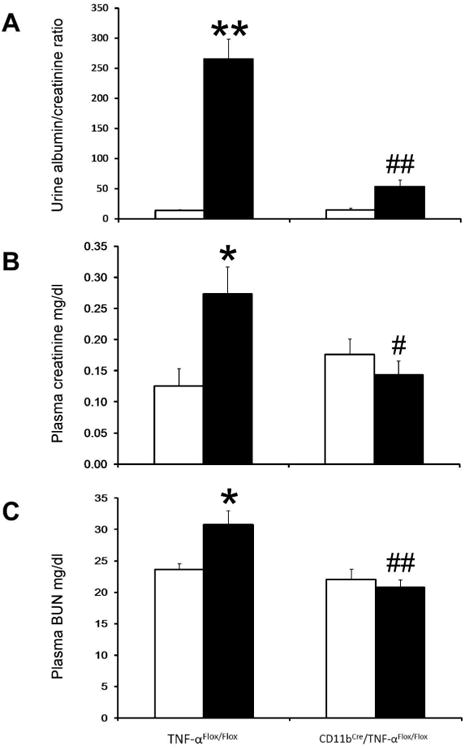
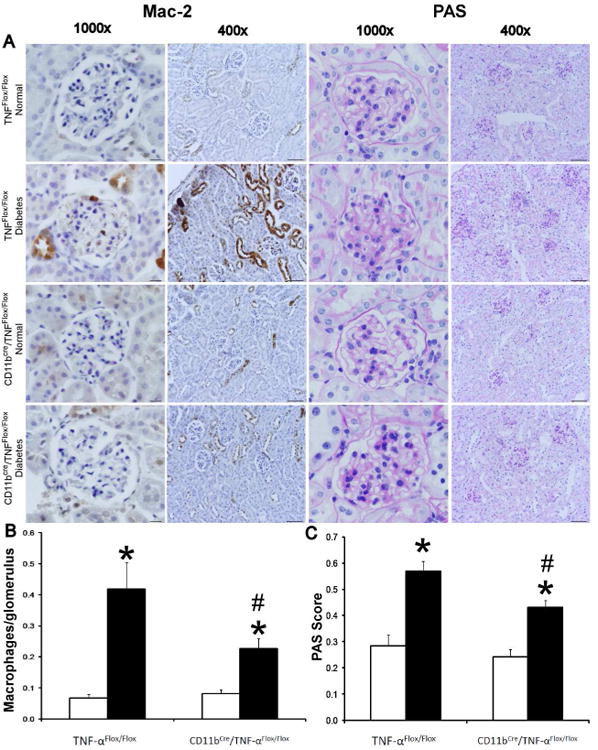
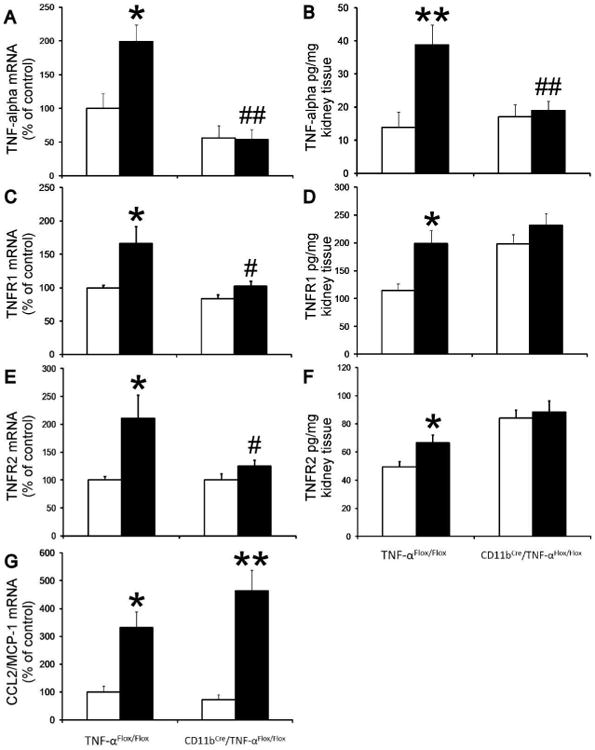
Monocyte/macrophage recruitment correlates strongly with the progression of diabetic nephropathy. Tumor necrosis factor-α (TNF-α) is produced by monocytes/macrophages but the direct role of TNF-α and/or macrophage-derived TNF-α in the progression of diabetic nephropathy remains unclear. Here we tested whether inhibition of TNF-α confers kidney protection in diabetic nephropathy via a macrophage-derived TNF-α-dependent pathway. Compared to vehicle-treated mice, blockade of TNF-α with a murine anti-TNF-α antibody conferred kidney protection in Ins2(Akita) mice as indicated by reductions in albuminuria, plasma creatinine, histopathologic changes, kidney macrophage recruitment, and plasma inflammatory cytokine levels at 18 weeks of age. To assess the direct role of macrophage-derived TNF-α in diabetic nephropathy, we generated macrophage-specific TNF-α-deficient mice (CD11b(Cre)/TNF-α(Flox/Flox)). Conditional ablation of TNF-α in macrophages significantly reduced albuminuria, the increase in plasma creatinine and blood urea nitrogen, histopathologic changes, and kidney macrophage recruitment compared to diabetic TNF-α(Flox/Flox) control mice after 12 weeks of streptozotocin-induced diabetes. Thus, production of TNF-α by macrophages plays a major role in diabetic renal injury. Hence, blocking TNF-α could be a novel therapeutic approach for treatment of diabetic nephropathy.


Figures

Figure 1
Figure 1. Effects of TNF-α inhibition on renal function in Ins2Akita mice
Ins2Akita and their wild type littermate mice were treated with TNF-α inhibitor, captopril or vehicle for 9 weeks. Urine and plasma were collected for measurement of urine albumin/creatinine ratio (A) and plasma creatinine (B) at 18 wk of age. Data are presented as mean ± SEM. *p<0.0001 compared to normal. #p<0.01, ##p<0.0001 compared to Ins2Akita+vehicle.
Figure 2
Figure 2. Effects of TNF-α inhibition on macrophage recruitment and histological changes in Ins2Akita mice
A) Immunohistochemical staining for Mac-2 positive macrophages in glomeruli and PAS-stained sections at 18 wk of age. Images are representative of 7-15 mice in each group. B) Summary data for macrophages/glomerulus. C) Summary data for glomerular PAS score. Data are presented as mean ± SEM. *p<0.01, **p<0.0001 compared to normal. Scale bar: 10 μm.
Figure 3
Figure 3. Effects of TNF-α inhibition on inflammatory cytokines in Ins2Akita mice
Ins2Akita and their wild type littermate mice were treated with TNF-α inhibitor, captopril or vehicle for 9 weeks. Plasma levels of GMCSF, KC, TNF- α and MCP-1 were determined at 18 wks of age. Data are presented as mean ± SEM. *p<0.05, **p<0.01, ***p<0.001 compared to normal.
Figure 4
Figure 4. Effects of TNF-α inhibition on kidney TNF receptors expression in lns2Akita mice
RT-PCR was performed on whole mouse kidney total RNA at 18 wk of age. TNFR1 (A) and TNFR2 (B) mRNA expression were normalized with GAPDH mRNA. Results are means ± SEM. *p<0.01 compared to normal; #p<0.05, ##p<0.01 compared to Ins2Akita±vehicle.
Figure 5
Figure 5. Characterization of CD11bCre/TNF-αFlox/Flox mice
Bone marrow derived (A) or peritoneal (B) macrophages were isolated from TNF-αFlox/Flox and CD11bCre/TNF-αFlox/Flox mice after treatment with LPS or vehicle for 24 hours. RNA was isolated from cells for qRT-PCR quantitation of TNF-α. Results are means ± SEM. Open bar, non-stimulated macrophages; black-filled bar, LPS-stimulated macrophages. *p<0.01, **p<0.0001 compared to non-stimulated macrophages TNF-αFlox/Flox; #p<0.01 ##p<0.0001 compared to LPS-stimulated macrophages TNF-αFlox/Flox.
Figure 6
Figure 6. Selective TNF-α depletion in macrophages reduces renal dysfunction in diabetic mice
Mouse urinary albumin/creatinine ratio (A), plasma creatinine (B), and BUN (C) were determined after 12 weeks of STZ-induced type 1 diabetes. Results are means ± SEM. Open bar, normal group; black-filled bar, diabetic group. *p<0.05, **p<0.01 compared to normal TNF-αFlox/Flox; #p<0.05, ##p<0.01 compared to diabetic TNF-αFlox/Flox.
Figure 7
Figure 7. Selective TNF-α depletion in macrophages reduces macrophage recruitment and histological changes in diabetic mice
A) Immunohistochemical staining for Mac-2 positive macrophages in glomeruli and PAS-stained sections after 12 weeks of STZ-induced type 1 diabetes. Images are representative of 7-12 mice in each group. B) Summary data for macrophages/glomerulus. C) Summary data for glomerular PAS score. Data are presented as mean ± SEM. *p<0.01 compared to normal; #p<0.05 compared to diabetes TNF-αFlox/Flox. Scale bar: 10 μm.
Figure 8
Figure 8. Selective TNF-α depletion in macrophages prevented the increase in kidney TNF-α, TNFR1 and TNFR2 expression in diabetic mice
RT-PCR was performed on whole mouse kidney total RNA after 12 weeks following diabetes. TNF-α (A), TNFR1 (C), TNFR2 (E) and MCP-1 (G) mRNA expression were normalized with GAPDH mRNA. Kidney TNF-α (B), TNFR1 (D) and TNFR2 (F) proteins were determined using Elisa kits according to manufacturer's protocol. Open bar, normal group; black-filled bar, diabetic groups. Results are means ± SEM. *p<0.05; **p<0.01 compared to normal; #p<0.05; ##p<0.01 compared to diabetic TNF-αFlox/Flox.

Comment in

References

    1. Boyle JP, Thompson TJ, Gregg EW, et al. Projection of the year 2050 burden of diabetes in the US adult population: dynamic modeling of incidence, mortality, and prediabetes prevalence. Popul Health Metr. 2010;8:29. - PMC - PubMed
    1. Baud L, Oudinet JP, Bens M, et al. Production of tumor necrosis factor by rat mesangial cells in response to bacterial lipopolysaccharide. Kidney Int. 1989;35:1111–1118. - PubMed
    1. Hruby ZW, Lowry RP. Spontaneous release of tumor necrosis factor alpha by isolated renal glomeruli and cultured glomerular mesangial cells. Clin Immunol Immunopathol. 1991;59:156–164. - PubMed
    1. Tipping PG, Leong TW, Holdsworth SR. Tumor necrosis factor production by glomerular macrophages in anti-glomerular basement membrane glomerulonephritis in rabbits. Lab Invest. 1991;65:272–279. - PubMed
    1. Wu TH, Wu SC, Huang TP, et al. Increased excretion of tumor necrosis factor alpha and interleukin 1 beta in urine from patients with IgA nephropathy and Schonlein-Henoch purpura. Nephron. 1996;74:79–88. - PubMed

Publication types

MeSH terms