. 2015 Jul 16;523(7560):366-9.
doi: 10.1038/nature14495. Epub 2015 Jun 10.

Structural basis for retroviral integration into nucleosomes

Affiliations

Structural basis for retroviral integration into nucleosomes

Daniel P Maskell et al. Nature. .

Abstract

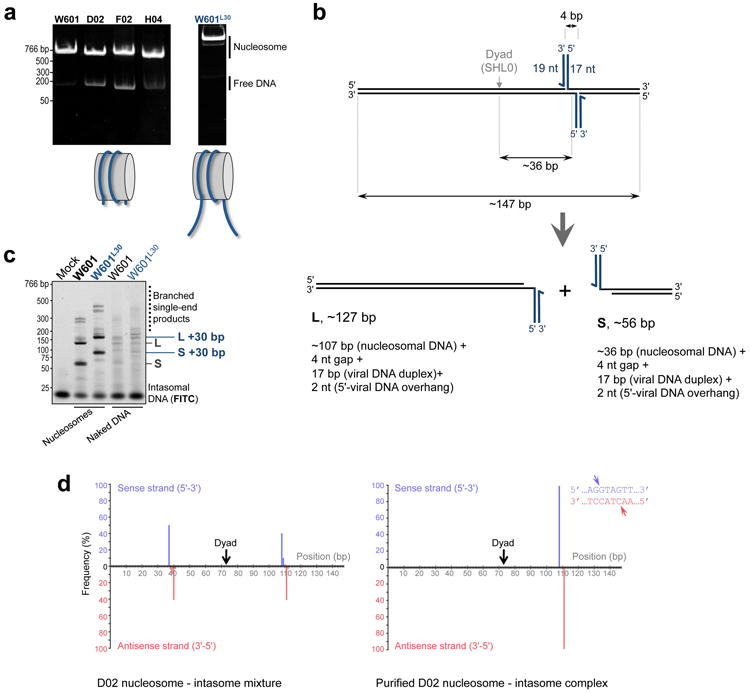
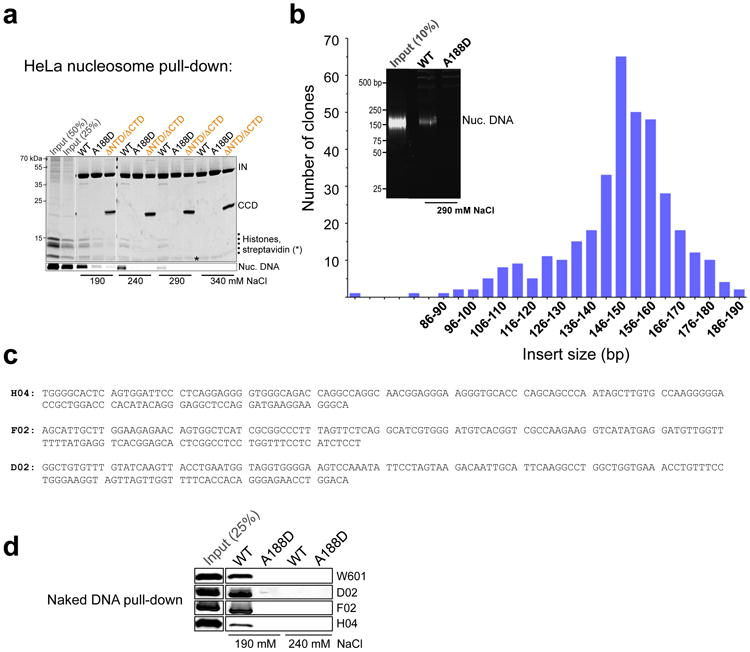
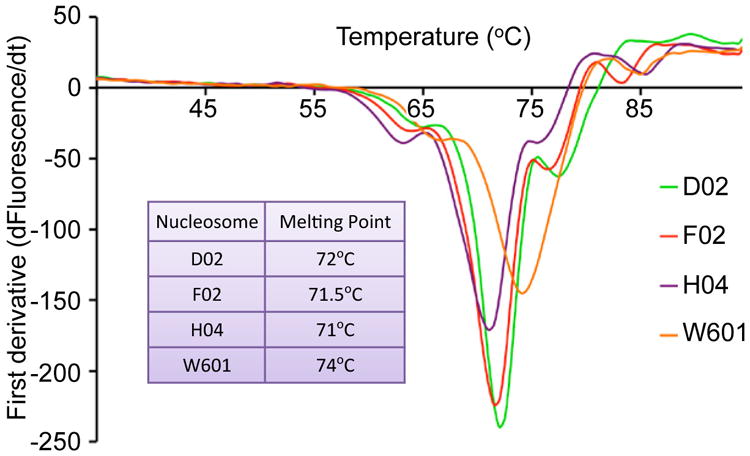
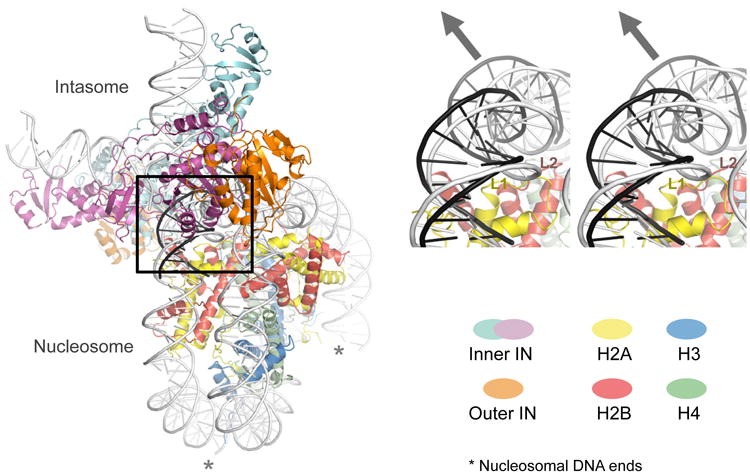
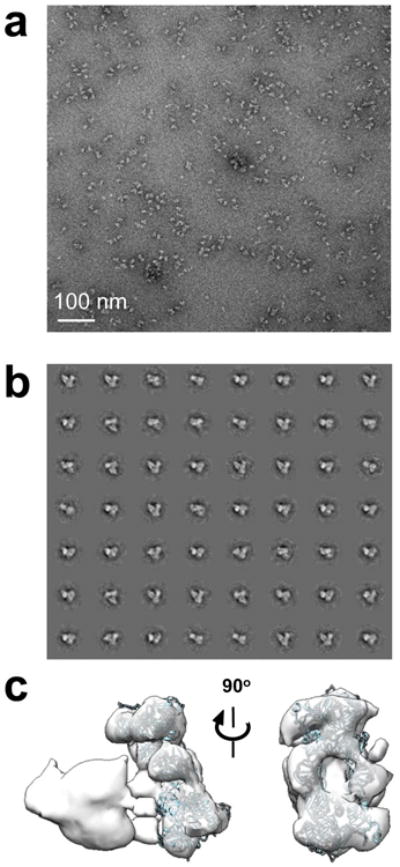
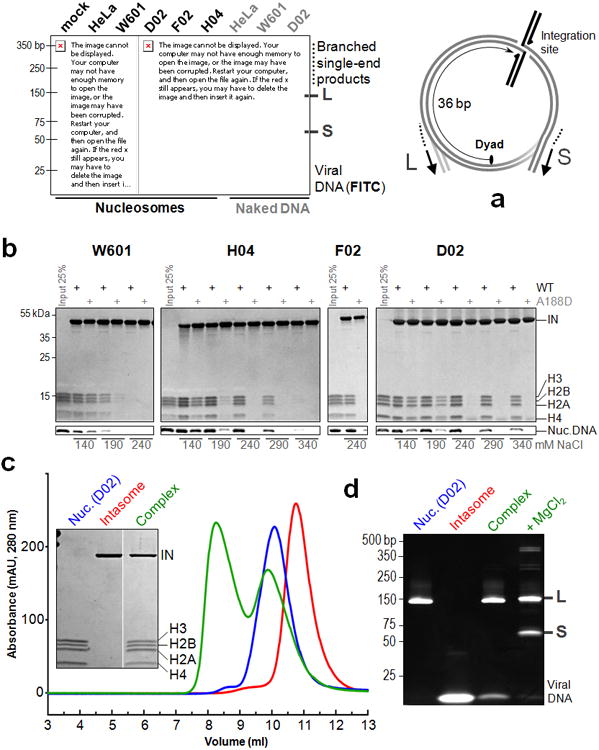
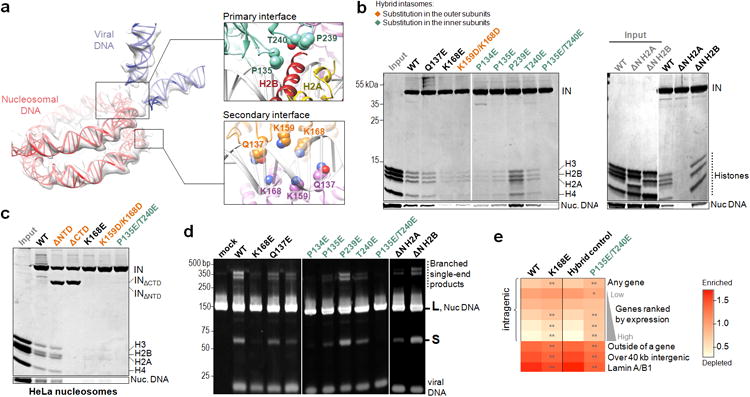
Retroviral integration is catalysed by a tetramer of integrase (IN) assembled on viral DNA ends in a stable complex, known as the intasome. How the intasome interfaces with chromosomal DNA, which exists in the form of nucleosomal arrays, is currently unknown. Here we show that the prototype foamy virus (PFV) intasome is proficient at stable capture of nucleosomes as targets for integration. Single-particle cryo-electron microscopy reveals a multivalent intasome-nucleosome interface involving both gyres of nucleosomal DNA and one H2A-H2B heterodimer. While the histone octamer remains intact, the DNA is lifted from the surface of the H2A-H2B heterodimer to allow integration at strongly preferred superhelix location ±3.5 positions. Amino acid substitutions disrupting these contacts impinge on the ability of the intasome to engage nucleosomes in vitro and redistribute viral integration sites on the genomic scale. Our findings elucidate the molecular basis for nucleosome capture by the viral DNA recombination machinery and the underlying nucleosome plasticity that allows integration.


Figures

Extended Data Figure 1
Extended Data Figure 1. PFV integration into recombinant mono-nucleosomes
a, W601, D02, F02 and H04 nucleosome core particles (left) and W601 nucleosome with 30-bp tails mimicking linker DNA (W601L30, right) were separated by native PAGE and detected by staining with ethidium bromide; b, Major products of PFV integration into a nucleosome core particle. Concerted integration of intasomal oligonucleotides (blue lines) into discontinuous tDNA (black lines) produces pairs of strand transfer products containing viral DNA mimics joined to tDNA fragments via 4-bp gaps; c, PFV integration into nucleosome core particles (W601) and extended nucleosomes (W601L30). Fluorescein-labeled intasomal DNA and reaction products were separated by PAGE and detected by fluorescence scanning. Migration positions of the strand transfer products obtained with W601L30 nucleosome shift relative to those with the W601 core particle by ∼30 bp. Thus, linker DNA does not appear to influence integration; d, Positions of integration events on D02 nucleosomal DNA before (left) or after (right) purification of the complex. The histograms show relative frequencies of integration events along the D02 DNA fragment into the top (blue bars) or bottom (pink bars) strands. The inset shows the nucleotide sequence at the preferred integration site; arrowheads indicate precise positions of the major integration events into the top and bottom strands of D02 DNA.
Extended Data Figure 2
Extended Data Figure 2. Pull-down of native nucleosomes and naked DNA by biotinylated PFV intasome
a, Mono-nucleosomes prepared by micrococcal nuclease digestion of HeLa cell chromatin were incubated with biotinylated intasomes under conditions of indicated ionic strength (190-240 mM NaCl). The intasomes used were WT, A188D or a hybrid intasome lacking the NTDs and CTDs on the outer subunit (indicated as ΔNTD/ΔCTD; see main text and Extended Data Fig. 6a-c for details of hybrid intasome design). The intasome-nucleosome complexes were isolated on streptavidin agarose and separated by SDS PAGE. Proteins and nucleosomal DNA were detected by staining with Coomassie Blue and GelRed, respectively. Two leftmost lanes contained 50% and 25% of input nucleosomes, as indicated. Migration positions of protein sizes standards (kDa) are shown to the left of the gel; b, Isolation of HeLa nucleosomes preferentially binding to the PFV intasome. Biotinylated WT or A188D intasomes were incubated with 10-fold excess HeLa nucleosomes in the presence of 290 mM NaCl. Nucleosomal DNA recovered with WT intasome was cloned into a bacterial vector; the histogram depicts distribution of nucleosomal insert sizes obtained in this experiment. The inset shows separation of deproteinized nucleosomal DNA from 10% of input nucleosome material and from the fractions recovered with WT and A188D intasomes; c, Nucleotide sequences of three human DNA fragments (H04, F02 and D02) recovered with the intasome and used to assemble recombinant nucleosomes in this work; d, Naked W601 D02, F02 or H04 DNA was incubated with biotinylated WT or A188D intasomes in the presence of 190 or 240 mM NaCl, as indicated DNA fractions recovered after pulled down on streptavidin beads were separated by PAGE and detected by staining with GelRed.
Extended Data Figure 3
Extended Data Figure 3. Thermal denaturation of recombinant nucleosomes
Derivative melt profiles of recombinant nucleosomes used in this study. The table in the inset shows experimentally determined melting temperatures.
Extended Data Figure 4
Extended Data Figure 4. Overview of the cryo-EM data
a, Representative micrograph of frozen hydrated intasome-nucleosome complex; b, Two-dimensional class averages (phase-flipped only; box size: 26 nm); c, Euler angle distribution of all particles included in the final three-dimensional reconstruction. Sphere size relates to particle number; d, Gold standard Fourier-shell correlation and resolution using the 0.143 criterion; e, Three-dimensional volume of the intasome-nucleosome complex refined with RELION; f, Match between reference free two dimensional class averages and 3D re-projections of the cryo-EM structure. 2D class averages of fully CTF corrected particles are matched with the re-projections of the refined 3D structure before map sharpening (post-processing); 30-6 Å band pass filter imposed; g, Overview of the 3D classification and structure refinement. The initial negative stain structure was used for one round of structure refinement using a smaller cryo dataset. The resulting map was used as a starting model for one round of 3D classification (three classes) on a complete cryo dataset. Particles from the two most populated 3D classes were merged and used for one further round of 3D classification (six classes). Each 3D class was refined independently; the most populated 3D class comprising 53,887 particles refined to 7.8 Å resolution.
Extended Data Figure 5
Extended Data Figure 5. Nucleosomal DNA plasticity
Overview of the intasome-nucleosome complex structure (left) and a magnified stereo view of nucleosomal DNA engaged within tDNA binding cleft of the intasome (right). DNA conformations as in free nucleosomes (PDB ID 1KX5) and as tDNA in complex with the PFV intasome (3OS1) are shown in light and dark gray, respectively; the arrowhead shows approximate direction of the DNA deformation. Asterisks indicate nucleosomal DNA ends.
Extended Data Figure 6
Extended Data Figure 6. Hybrid intasomes: structure-based design and validation in vitro
a, Views on the environment of Lys120 and Asp273 PFV IN residues within the intasome structure. Protein is shown as cartoons with side chains of selected amino acid residues shown as sticks; the cartoons and carbon atoms of the inner and outer IN chains are shown in green and light-orange, respectively. Lys120 of the outer and Asp273 of the inner IN subunit are involved in a network of interactions; in contrast, Lys120 of the inner and Asp273 of the outer IN subunit are solvent-exposed. Consequently, IN mutants harboring substitutions of Lys120 or Asp273 can only play a role in the inner or outer intasomal subunits, respectively; b, PFV IN mutants K120E and D273K are co-dependent for intasome assembly. Products of intasome assembly using WT, D273K, K120E PFV IN or an equimolar mixture of D273K and K120E INs were separated by size exclusion chromatography. Elution positions of the intasome, IN and free DNA are indicated. The assembly was successful with WT IN or with a mixture of the two IN mutants, but not with either of the IN variants separately; c, Validation of the hybrid intasome design. Left: possible types of strand transfer products obtained by reacting the intasome with circular DNA target (pGEM, black lines). Full-site integration (strand transfer involving both intasomal DNAs, dark blue lines) results in a linear concerted product, which may be targeted by further strand transfer events. Half-site integration (strand transfer involving a single intasomal DNA end) results in a circular branched single-end product. Right: strand transfer assays using mutant intasomes and circular pGEM DNA target. The intasomes were assembled using WT IN or a mixture of K120E and D273K mutants, as indicated atop the gel. IN variants indicated with a cross () additionally incorporated the E221Q amino acid substitution that disables the enzyme active site. Reaction products were separated by agarose gel electrophoresis. Intasomes were used at indicated concentrations; the leftmost lane contained a mock sample, which received no intasome. Migration positions of the reaction products, intasomal DNA and unreacted supercoiled (s.c.) pGEM are indicated to the right of the gel. As predicted, the strand transfer function of the hybrid intasome strictly requires the active site from the K120E (inner) IN subunit, but not the D273K (outer) subunit; d, Strand transfer activity of mutant intasomes on naked plasmid DNA. Mutations indicated in orange or green were restricted to the outer or inner subunits of the hybrid PFV intasome, respectively.
Extended Data Figure 7
Extended Data Figure 7. Infectivity of the mutant PFV vectors
a, Schematic of the experiments. PFV vectors were produced in 293T cells transfected with DNA constructs encoding PFV GAG, POL and ENV, plus a GFP reporter transfer vector (pMD9). The virus, concentrated by centrifugation, was applied onto target HT1080 cells. Five days post-infection the cells were analyzed by FACS and/or used for isolation of genomic DNA and integration site sequencing. IN mutations were introduced into the packaging construct encoding POL (pcop-POL); b, Validation of the hybrid intasome design in viral culture conditions. PFV GFP virus was produced using WT, K120E, D273K POL packaging construct or a mixture of K120E and D273K mutants. The variants indicated with a cross () additionally contained a double point mutation inactivating the IN active site (D185N/E221Q). The graph and the Western bot show mean relative infectivity and GAG contents (pr71 and p68) of the resultant viruses, respectively. All infectivity experiments were done at least in triplicate, with two or more independent virus preparations; error bars represent standard deviations. The K120E and D273K IN mutants are co-dependent for production of infectious PFV vector, and that the functional active site of K120E IN component is essential for production of infectious hybrid virus; c, Relative infectivity of the PFV vectors harboring WT, K168E, or active-site-dead D185N/E221Q (indicated with a cross, ) IN; d, Relative infectivities of hybrid viruses produced using D273K/D185N/E221Q (indicated as D273K ()) and K120E, K120E/D185N/E221Q (), K120E/P135E, K120E/T240E, and K120E/P135E/T240E. The Western blots below the graphs show GAG (pr71 and p68) contents of the respective PFV vector preps.
Extended Data Figure 8
Extended Data Figure 8. Local nucleotide sequence biases at PFV integration sites
Nucleotide sequence preferences at PFV integration sites in cellula (WT, K168E, hybrid control and P135E/T240E) or in vitro displayed in the form of sequence logos. The heights of the logos correspond to the maximum information content at each position (maximum information content being 2 bit per base). Position 0 corresponds to the target nucleotide joined to the processed U5 PFV end.
Extended Data Figure 9
Extended Data Figure 9. Negative-stain electron microscopy analysis
a, Representative micrograph; b, reference free class averages; c, 3D electron density map of the intasome-nucleosome complex with a docked intasome structure. Note that DNA density is not recovered with negative-stain EM.
Figure 1
Figure 1. Nucleosome capture by the PFV intasome
a , Integration into HeLa-derived or recombinant (W601, H04, D02 or F02) core nucleosomes or naked DNA. Fluorescein-labeled intasomal DNA and reaction products were separated by PAGE and detected by fluorescence scanning. The major long (L, ∼127 bp) and short (S, ∼56 bp) products, result from concerted strand transfer at nucleosomal SHL±3.5 positions, which are separated from the dyad by 3.5 turns of DNA helix or 36 bp. The products include viral DNA joined to nucleosomal DNA fragments (Extended Data Fig. 1b); b, Pull-down of recombinant nucleosomes with biotinylated intasome in the presence of variable NaCl concentrations; where indicated, the intasome was assembled with A188D IN. Bound material, separated in SDS-PAGE gels, was stained to detect proteins (IN, H3, H2A, H2B and H4) and nucleosomal DNA (Nuc. DNA); c, Isolation of the intasome - D02 nucleosome complex by size exclusion chromatography. Peak fractions of intasome (red trace), D02 nucleosome (blue) and the complex (green) were separated by SDS-PAGE (inset); d, DNAs from D02 nucleosome, intasome, as well as the intasome-nucleosome complex before and after incubation with 5 mM MgCl2 were separated by PAGE and detected with GelRed.
Figure 2
Figure 2. Structure of the intasome-nucleosome complex
a, Segmented electron density map as semi-transparent surface with docked intasome and nucleosome structures shown as ribbons. H2B, the N-terminal tail of H2A (H2A-N), the CTD and one of the CCD dimers are indicated; b, Nucleosomal DNA within the tDNA-binding cleft of the intasome. DNA conformations as in available nucleosome structures (left) and as in the crystals of the PFV target capture complex (right) produce local electron density cross-correlation scores of 0.36 and 0.70, respectively.
Figure 3
Figure 3. Mutagenesis of the intasome-nucleosome interface
a , DNA component of the complex. The insets show pertinent details of the interface, with selected IN amino acid residues as spheres; b, Pull-down of H04 nucleosomes assembled with WT or variant (ΔN H2A or ΔN H2B, lacking residues 1-12 or 1-23, respectively) histones with biotinylated intasomes at 240 mM (left panel) or 290 mM NaCl (right panel). Substitutions in hybrid PFV intasomes were restricted to the outer subunits or inner IN subunits (indicated in orange and cyan font, respectively); c, Pull-down of HeLa nucleosomes with biotinylated intasomes at 240 mM NaCl; d, Reactivity of intasome variants with W601 nucleosome assembled with WT or variant histones. DNA products, separated by PAGE, were detected with GelRed; e, Heat map of relative integration frequencies. Each row represents a specific feature characteristic of the targeted genomic region. The color scale indicates whether a feature is enriched (red) or depleted (light orange) compared to the in vitro control. Each column represents a PFV vector variant tested: WT, K168E, hybrid control (vector produced using a combination of K120E and D273K/D185N/E221Q pcoP-POL packaging vectors encoding functional inner and catalytically incompetent outer IN subunits, respectively) or P135E/T240E (the substitutions introduced into the inner subunits in the hybrid control background). Asterisks indicate significant departures of the mutants from their respective controls (χ2 test: *P< 0.01, **P< 10-5).

References

    1. Li M, Mizuuchi M, Burke TR, Jr, Craigie R. Retroviral DNA integration: reaction pathway and critical intermediates. EMBO J. 2006;25:1295–1304. - PMC - PubMed
    1. Hare S, Gupta SS, Valkov E, Engelman A, Cherepanov P. Retroviral intasome assembly and inhibition of DNA strand transfer. Nature. 2010;464:232–236. - PMC - PubMed
    1. Maertens GN, Hare S, Cherepanov P. The mechanism of retroviral integration from X-ray structures of its key intermediates. Nature. 2010;468:326–329. - PMC - PubMed
    1. Montano SP, Pigli YZ, Rice PA. The mu transpososome structure sheds light on DDE recombinase evolution. Nature. 2012;491:413–417. - PMC - PubMed
    1. Luger K, Mader AW, Richmond RK, Sargent DF, Richmond TJ. Crystal structure of the nucleosome core particle at 2.8. A resolution. Nature. 1997;389:251–260. - PubMed

Publication types

MeSH terms

Associated data