. 2015 Jun 10:4:e08069.
doi: 10.7554/eLife.08069.

Inter-individual stereotypy of the Platynereis larval visual connectome

Affiliations

Inter-individual stereotypy of the Platynereis larval visual connectome

Nadine Randel et al. Elife. .

Abstract

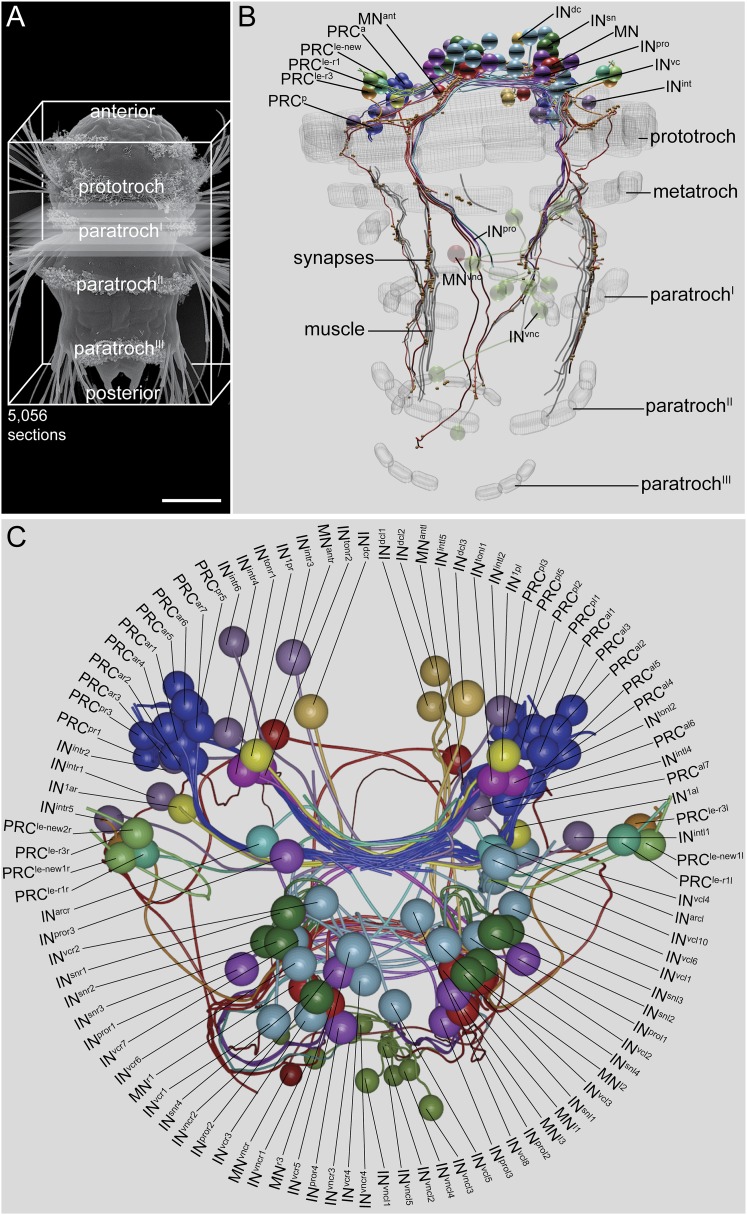
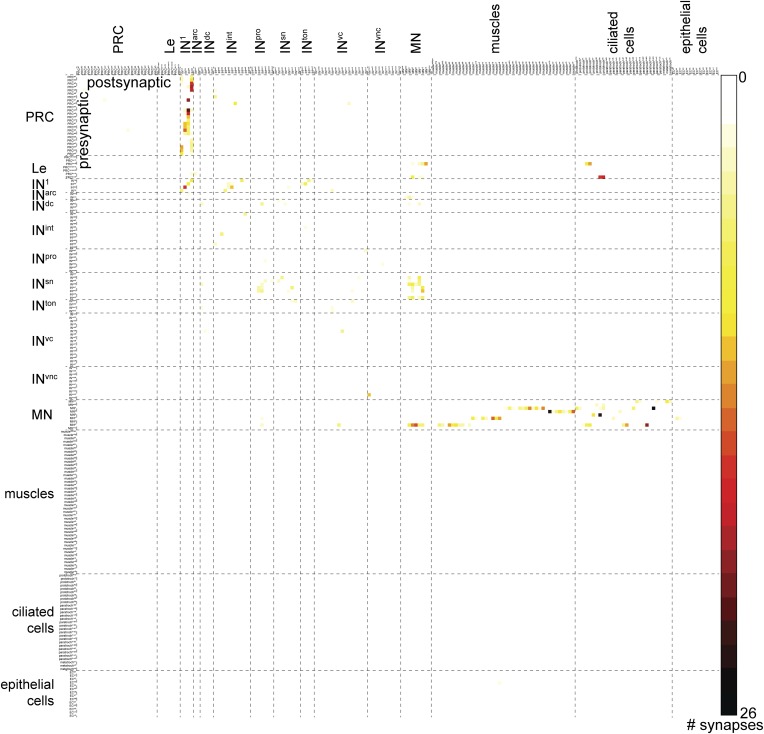
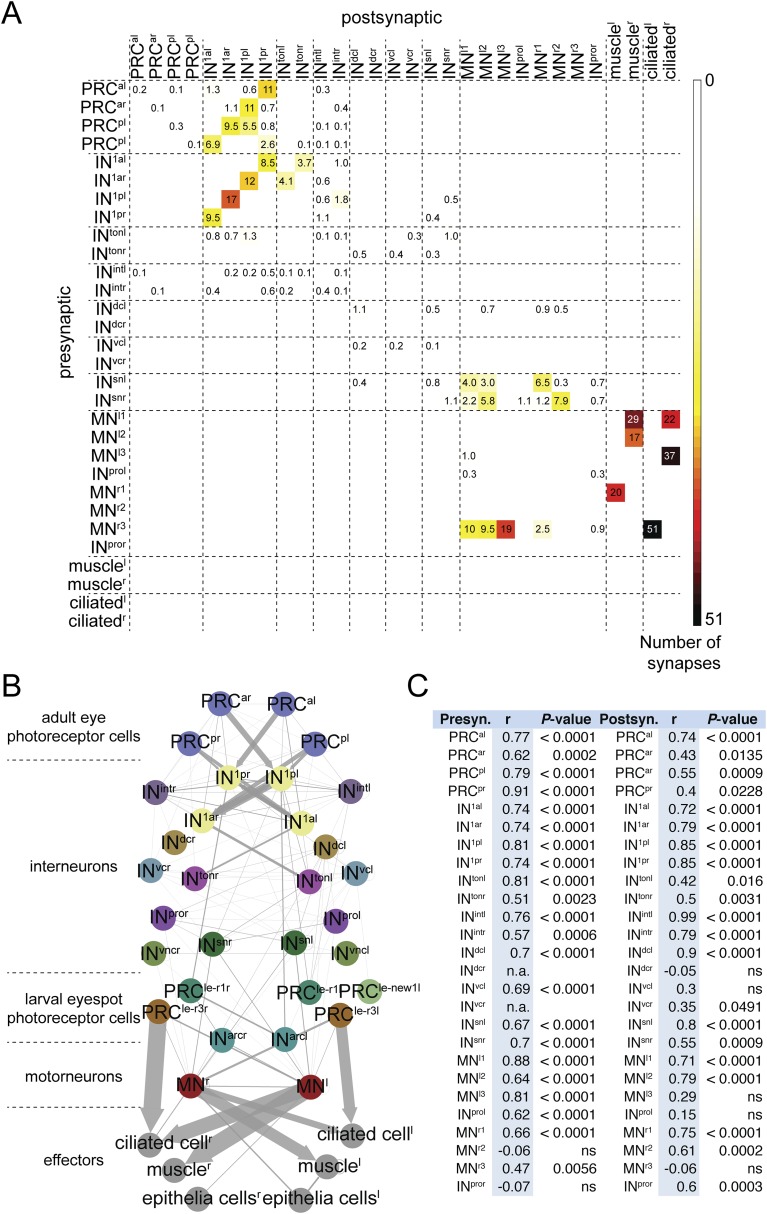
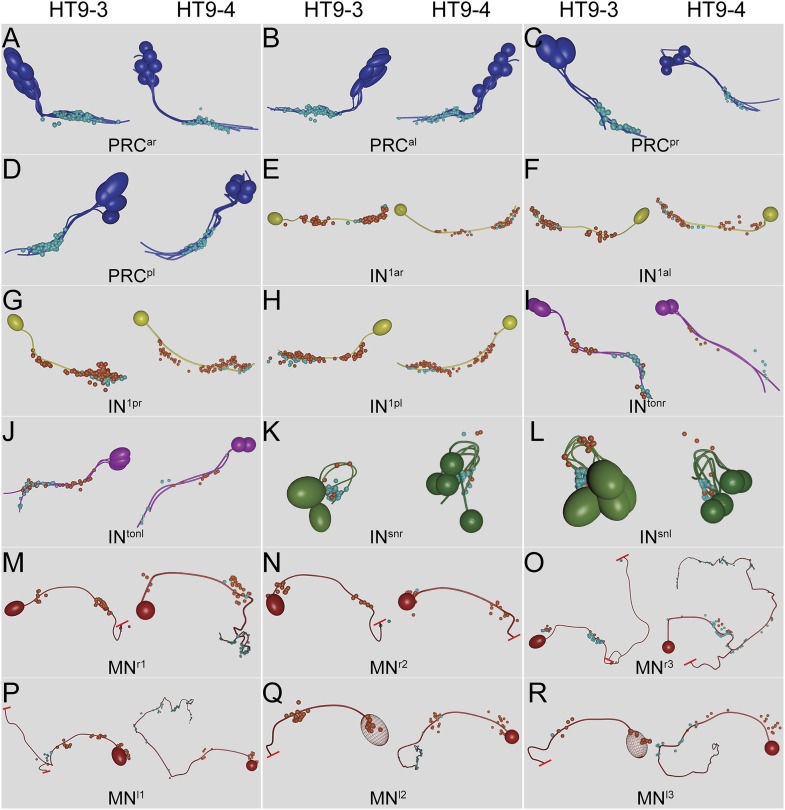
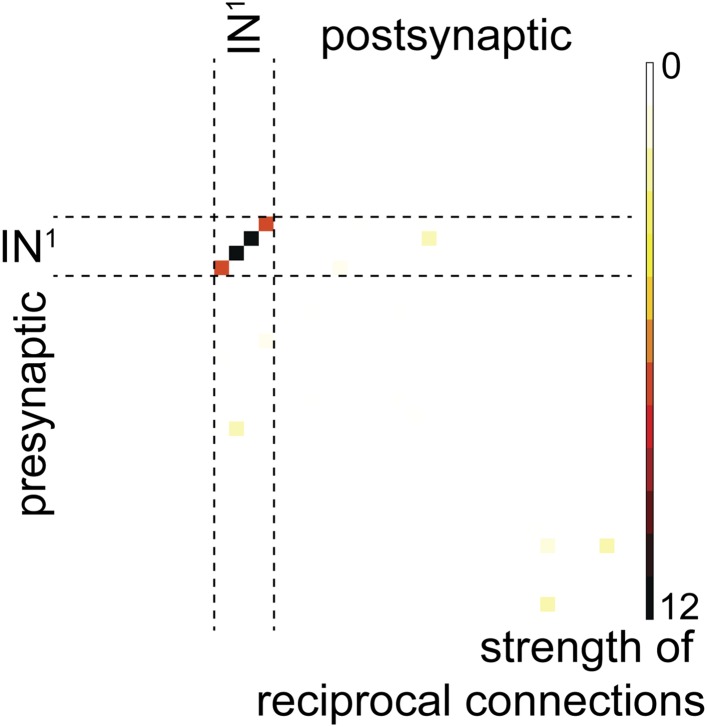
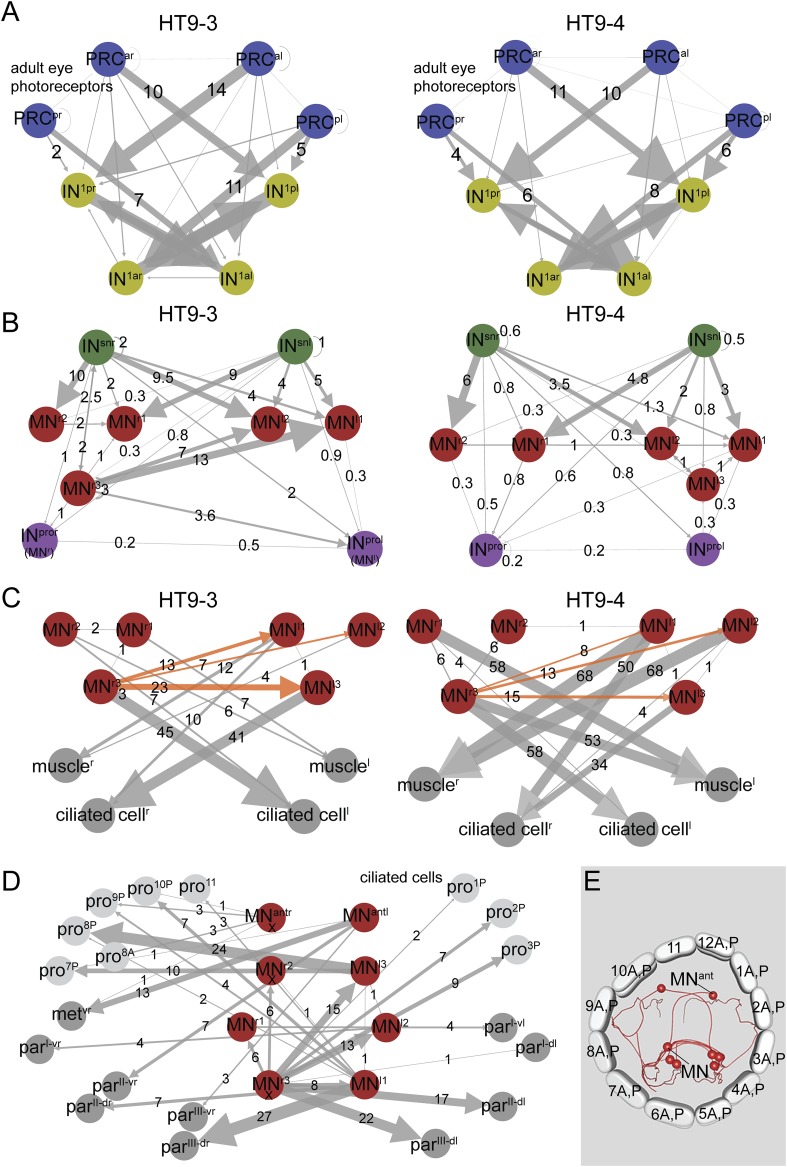
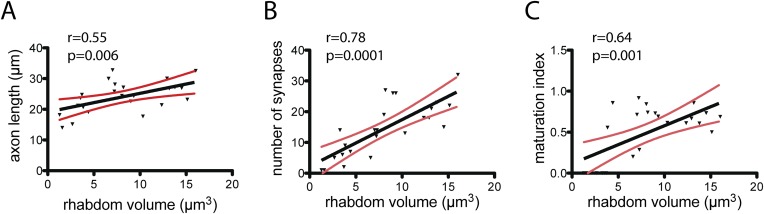
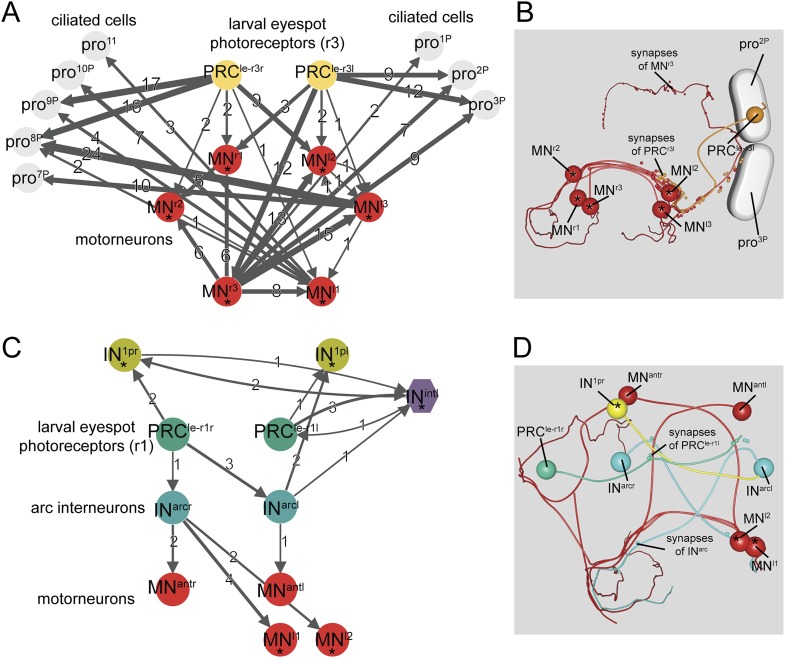
Developmental programs have the fidelity to form neural circuits with the same structure and function among individuals of the same species. It is less well understood, however, to what extent entire neural circuits of different individuals are similar. Previously, we reported the neuronal connectome of the visual eye circuit from the head of a Platynereis dumerilii larva (Randel et al., 2014). We now report a full-body serial section transmission electron microscopy (ssTEM) dataset of another larva of the same age, for which we describe the connectome of the visual eyes and the larval eyespots. Anatomical comparisons and quantitative analyses of the two circuits reveal a high inter-individual stereotypy of the cell complement, neuronal projections, and synaptic connectivity, including the left-right asymmetry in the connectivity of some neurons. Our work shows the extent to which the eye circuitry in Platynereis larvae is hard-wired.

Keywords: Platynereis dumerilii; connectome; neural circuit; neuroscience; stereotypy.


Conflict of interest statement

The authors declare that no competing interests exist.

Figures

Figure 1.
Figure 1.. Visual eye and larval eyespot circuit reconstructed from a full-body dataset (HT9-4).
(A) Scanning electron micrograph of a 72 hpf larva, dorsal view. (B, C) Blender visualization of the cell complement in ventral (B) and anterior (C) views. IN1, primary interneuron; INarc, arc interneuron; INdc, dorsal interneuron; INint, intrinsic interneuron; INsn, Schnörkel-interneuron; INton, trans-optic neuropil interneuron; INpro, projection interneuron; INvc, ventral interneuron; INvnc, ventral nerve cord interneuron; MN, ventral motor neuron; MNant, anterior motor neuron; MNvnc, ventral nerve cord motor neuron; PRC, photoreceptor cell of the visual eye; PRCle-r1/3, photoreceptor cell of the larval eye, expressing r-opsin3 or r-opsin1; a, anterior; p, posterior; l, left; r, right. Scale bar in (A) 50 μm. DOI: http://dx.doi.org/10.7554/eLife.08069.002
Figure 1—figure supplement 1.
Figure 1—figure supplement 1.. Full connectivity matrix of the visual and larval eye circuit of the fully reconstructed larva HT9-4.
DOI: http://dx.doi.org/10.7554/eLife.08069.004
Figure 2.
Figure 2.. Comparative analysis of HT9-3 and HT9-4 visual eye circuits.
(A) Geometric mean of the neuron types between both individuals, using the averaged synapse number of neuronal groups and the total synapse number on effectors. (B) Connectivity graph of the visual and larval eye circuit. Edges are weighted by averaged synapse number (neurons) or by sum of synapses (effectors). Nodes are colored using the color scheme of the neuron types. (C) Spearman correlation of the presynaptic and postsynaptic connections of cell groups in HT9-3 and HT9-4. Abbreviations are shown in Figure 1. DOI: http://dx.doi.org/10.7554/eLife.08069.006
Figure 2—figure supplement 1.
Figure 2—figure supplement 1.. Comparison of the neuronal projections and synapse positions of both individuals.
Neuronal projections and synapse positions of (A) PRCar, (B) PRCal, (C) PRCpr, (D) PRCpl, (E) IN1ar, (F) IN1al, (G) IN1pr, (H) In1pl, (I) INtonr, (J) INtonl, (K) INsnr, (L) INsnl, (M) MNr1, (N) MNr2, (O) MNr3, (P) MNl1, (Q) MNl2, and (R) MNl3 cells in HT9-3 and HT9-4. DOI: http://dx.doi.org/10.7554/eLife.08069.008
Figure 2—figure supplement 2.
Figure 2—figure supplement 2.. Reciprocal connection strength between all neuron pairs in the complete visual circuit (HT9-4).
Strength is defined as the geometric mean of the number of synapses of a given neuron ‘A’ on another neuron ‘B’ and the number of synapses of neuron ‘B’ on neuron ‘A’. Single neuron identifiers are not shown for simplicity. DOI: http://dx.doi.org/10.7554/eLife.08069.009
Figure 3.
Figure 3.. Subcircuits of the visual eye connectome of both individuals and the innervation of all ciliary bands in the fully reconstructed second larva (HT9-4).
(AD) Connectivity graphs show the connectivity between selected neuron groups and effectors. Edges are weighted by the number of synapses. The number of synapses is also shown for each edge. Nodes are colored using the color scheme of the neuron types. In AC, HT9-3 is left and HT9-4 right. (A) Connectivity graph of the grouped PRCs of the visual eyes with IN1 cells. The synapses of the PRCs from each eye are averaged. (B) Connectivity graph of INsn cells with MNs and INpro cells. The previous nomenclature of the INpro cells in HT9-3 identified as MNs is shown in brackets. (C) Connectivity graph of MNs and their effectors. The synapse numbers shown for ciliated cells and muscles represent the total number of synapses on groups of effector cells. (D) Connectivity graph of the MNs of the visual and larval eye circuit of HT9-4 with all ciliary bands. The synapse number of the metatroch and paratrochs are summed. Incompletely traced MNs are labeled with ‘X’. (E) Blender visualization of the MNs and prototroch cells, apical view. The prototroch cells are numbered in a clockwise fashion. The numbering of the MNs of the left and the right body side within a single larva is not consistent with anatomical pairs, to stick to the nomenclature introduced for HT9-3. Note that the prototroch cell in position 11 is unpaired. met, metatroch; par, paratroch; pro, prototroch; A, anterior; P, posterior. Additional abbreviations are shown in Figure 1. DOI: http://dx.doi.org/10.7554/eLife.08069.010
Figure 3—figure supplement 1.
Figure 3—figure supplement 1.. Maturation of photoreceptor connections in HT9-4.
(A) Relationship of rhabdom volume to photoreceptor axon length. (B) Relationship of rhabdom volume to photoreceptor synapse number. (C) Relationship of photoreceptor connectivity-maturation index to rhabdom volume. In AC the black line shows linear regression with 95% confidence interval (red lines). Pearson r and p-value are shown. DOI: http://dx.doi.org/10.7554/eLife.08069.011
Figure 4.
Figure 4.. Minimal eye circuit of the larval eye.
Neurons that are also part of the visual eye circuit are marked by an ‘asterisk’. Connectivity graph of the r-opsin3-expressing PRCr3 (A) and r-opsin1-expressing PRCr1 (C). Connectivity graph edges are weighted by the number of synapses and synapse numbers are shown. Blender visualization of the left PRCr3l cell (B) and PRCr1r circuitry (D). Abbreviations are shown in Figure 1. DOI: http://dx.doi.org/10.7554/eLife.08069.013

References

    1. Asadulina A, Conzelmann M, Williams EA, Panzera A, Jékely G. Object-based representation and analysis of light and electron microscopic volume data using Blender. BMC Bioinformatics. 2015 (in press) - PMC - PubMed
    1. Asadulina A, Panzera A, Verasztó C, Liebig C, Jékely G. Whole-body gene expression pattern registration in Platynereis larvae. EvoDevo. 2012;3:27. doi: 10.1186/2041-9139-3-27. - DOI - PMC - PubMed
    1. Berman GJ, Choi DM, Bialek W, Shaevitz JW. Mapping the stereotyped behaviour of freely moving fruit flies. Journal of the Royal Society, Interface / the Royal Society. 2014;11:20140672. doi: 10.1098/rsif.2014.0672. - DOI - PMC - PubMed
    1. Cardona A, Saalfeld S, Preibisch S, Schmid B, Cheng A, Pulokas J, Tomancak P, Hartenstein V. An integrated micro- and macroarchitectural analysis of the Drosophila brain by computer-assisted serial sectionelectron microscopy. PLOS Biology. 2010;8:e1000502. doi: 10.1371/journal.pbio.1000502. - DOI - PMC - PubMed
    1. Chou YH, Spletter ML, Yaksi E, Leong JC, Wilson RI, Luo L. Diversity and wiring variability of olfactory local interneurons in the Drosophila antennal lobe. Nature Neuroscience. 2010;13:439–449. doi: 10.1038/nn.2489. - DOI - PMC - PubMed

Publication types