. 2015 Jun 10;10(6):e0127218.
doi: 10.1371/journal.pone.0127218. eCollection 2015.

Rapid Morphological Change in the Masticatory Structures of an Important Ecosystem Service Provider

Affiliations

Rapid Morphological Change in the Masticatory Structures of an Important Ecosystem Service Provider

John W Doudna et al. PLoS One. .

Abstract

Humans have altered the biotic and abiotic environmental conditions of most organisms. In some cases, such as intensive agriculture, an organism's entire ecosystem is converted to novel conditions. Thus, it is striking that some species continue to thrive under such conditions. The prairie deer mouse (Peromyscus maniculatus bairdii) is an example of such an organism, and so we sought to understand what role evolutionary adaptation played in the success of this species, with particular interest in adaptations to novel foods. In order to understand the evolutionary history of this species' masticatory structures, we examined the maxilla, zygomatic plate, and mandible of historic specimens collected prior to 1910 to specimens collected in 2012 and 2013. We found that mandibles, zygomatic plates, and maxilla have all changed significantly since 1910, and that morphological development has shifted significantly. We present compelling evidence that these differences are due to natural selection as a response to a novel and ubiquitous food source, waste grain (corn, Zea mays and soybean, Glycine max).


Conflict of interest statement

Competing Interests: The authors have declared that no competing interests exist.

Figures

Fig 1
Fig 1. Locations of Peromyscus maniculatus bairdii trapping.
The map illustrates the spatial distribution of corn-soybean agricultural intensity in the Midwestern US. The locations indicated on the map are detailed in Table 1. They were chosen because concentrations of historical specimens from before 1910 were available from the region. Three of our locations (NILL, IOWA, and WAMN) are in regions of greater than 75% corn-soybean agriculture cover within the county, while the other three (MAKA, OTKA, and EMND) are in agricultural regions of less than 33% corn and soybean cover within the county. All contemporary specimens were collected from corn-soybean fields. Map available at: http://www.nass.usda.gov/Charts_and_Maps/Crops_County/cr-pl.asp.
Fig 2
Fig 2. Landmarks (circles) and semilandmarks (triangles) digitized onto each specimen.
Landmarks are detailed in Table 2.
Fig 3
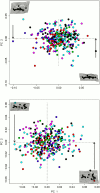
Fig 3. Tangent space for upper jaws (top) and mandibles (bottom).
PC axes 1 and 2 explain the maximum amount of variation in the data (upper jaws: 27 and 13%, mandibles: 25 and 13%). The thin plate spline deformation grids in each corner represent the largest difference among all specimens, by indicating what each structure looks like at the ends of PC axis 1 relative to a specimen at the origin (0,0), as described in the methods. Colors are locations as follows: Black: EMND; Red: IOWA; Green: MAKA; Blue: NILL; White: OTKA; Grey: WAMN. Sample sizes and abbreviations are as in Table 1.
Fig 4
Fig 4. Allometry of upper jaws and mandibles by time period.
Prediction lines represent a regression of shape values (common allometric component) within time period on the log of the centroid size [Log(Csize)], based on 150 historic and 160 contemporary specimens. Allometry tests show significant effects of size and year on shape for both structures. Interaction of size:period is significant for upper jaws, but not mandibles. Regression lines are historic upper jaws: CAC = 0.1876*Csize-0.5037; contemporary upper jaws: CAC = 0.08492*log(Csize)- 0.23; historic mandibles: CAC = 0.134*log(Csize)– 0.3886; contemporary mandibles: CAC = 0.1005*log(Csize)– 0.284.
Fig 5
Fig 5. Size differences in mouse upper jaws and mandibles.
All data depict average centroid size, which is calculated using all landmarks included in the morphometric analysis. Figures depict mandible and upper jaw size differences by location and year. Site abbreviations and sample sizes are as in Table 1. Sites with greater than or equal to 75% corn-soybean cover in the landscape are depicted in red, while sites with less than or equal to 33% corn-soybean cover are depicted in black. Bottom graphs illustrate the average size and 1 SE by time period.
Fig 6
Fig 6. Location-specific changes in Peromyscus maniculatus bairdii jaw shape.
Thin plate spline (TPS) deformation grids illustrate the changes in shape that have occurred in each location from approximately 1910 to 2012. TPS grids represent a hypothetical change in shape, based on required bending energies associated with making changes to a 2-dimensional object using the least amount of force. If an object is compared to itself, all lines would be parallel or perpendicular to all other lines, and all grid squares would be of equal size. These TPS grids are shown at 3x magnification to clarify changes. Parallel lines represent no change between objects, and all non-parallel lines represent a change in shape. Also, lines further apart represent a relative widening of that region relative to the rest of the structure, whereas lines that are closer together represent a relative shrinking of that region. Landmarks are as in Fig 2 and specimens are as described in Table 1.
Fig 7
Fig 7. Biomechanical ratios of jaw morphology.
Biomechanical ratios represent a measure of bite strength, and thus larger values represent greater bite strength at either the incisor or molars. Masseter length is the length from the condyle tip (jaw leverage) to the point of maximum curvature of the ventral side of the mandible. Temporalis length is the length from the condyle tip to the tip of the coronoid process. Incisor length in our study was the length from the condyle tip to the dorsal insertion point of the incisor (see methods for description of why the incisor was not included in the study). Molar length is the length between the condyle tip and the anterior insertion point of the first molar. These lengths are slight modifications from Anderson et al. [39]. Values in all graphs are ratios of lengths and are thus unitless. Site abbreviations and sample sizes are as in Table 1. Sites with greater than or equal to 75% corn-soybean cover in the landscape are depicted in red, while sites with less than or equal to 33% corn-soybean cover are depicted in black.

References

    1. Berry R. J. (1964) The evolution of an island population of the house mouse. Evolution 18: 468–483.
    1. Williams C. K. and Moore R. J.. (1989) Phenotypic adaptation and natural selection in the wild rabbit, Oryctolagus cuniculus, in Australia. J Anim Ecol 58: 495–507.
    1. Pergams O. R. and Ashley M. V.. (1999) Rapid morphological change in Channel Island deer mice. Evolution 53: 1573–1581. - PubMed
    1. Reznick D. N. and Ghalambor C. K.. (2001) The population ecology of contemporary adaptations: what empirical studies reveal about the conditions that promote adaptive evolution. Genetica 112: 183–198. - PubMed
    1. Vander Wal E., Garant D., Festa-Bianchet M., and Pelletier F.. (2013) Evolutionary rescue in vertebrates: evidence, applications and uncertainty. Philos Trans R Soc Lond B 368: 20120090 10.1098/rstb.2012.0090 - DOI - PMC - PubMed

Publication types

LinkOut - more resources