

IL13 activates autophagy to regulate secretion in airway epithelial cells
- PMID: 26062017
- PMCID: PMC4835964
- DOI: 10.1080/15548627.2015.1056967
IL13 activates autophagy to regulate secretion in airway epithelial cells
Abstract
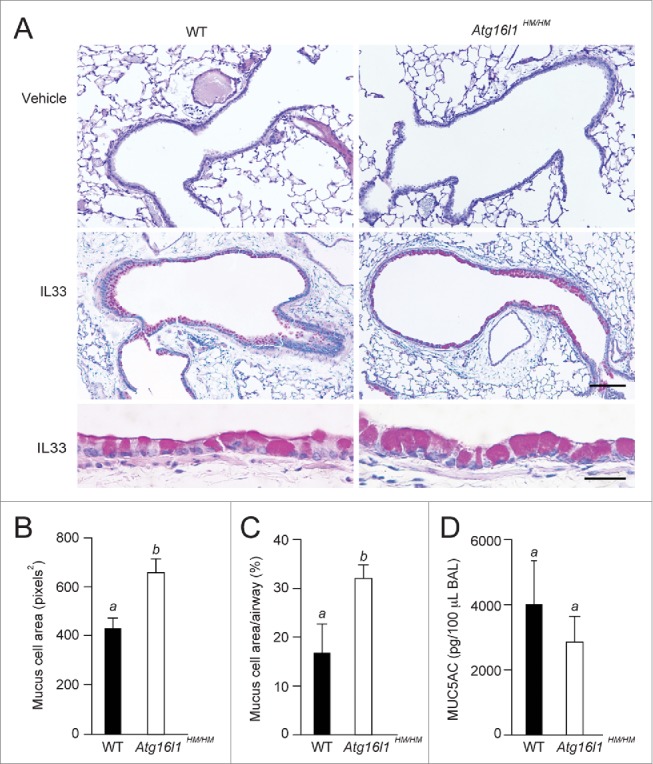
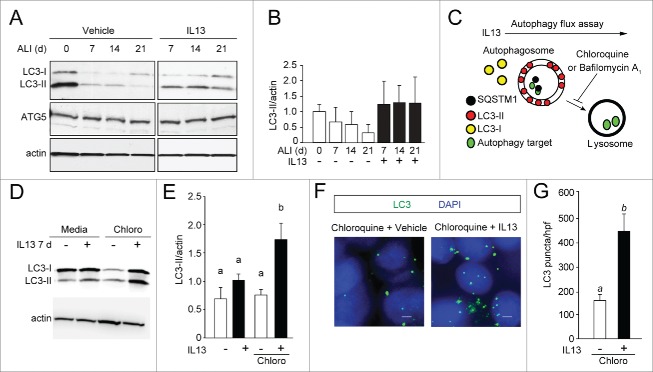
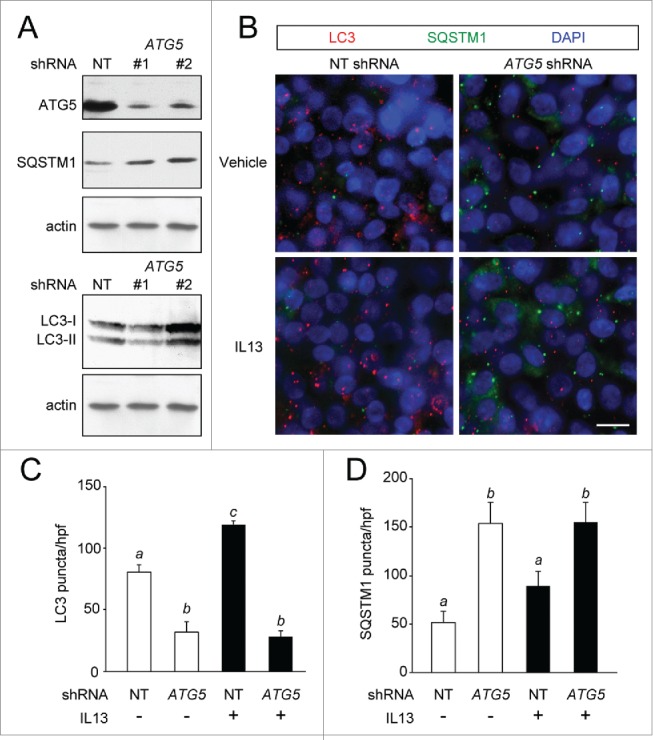
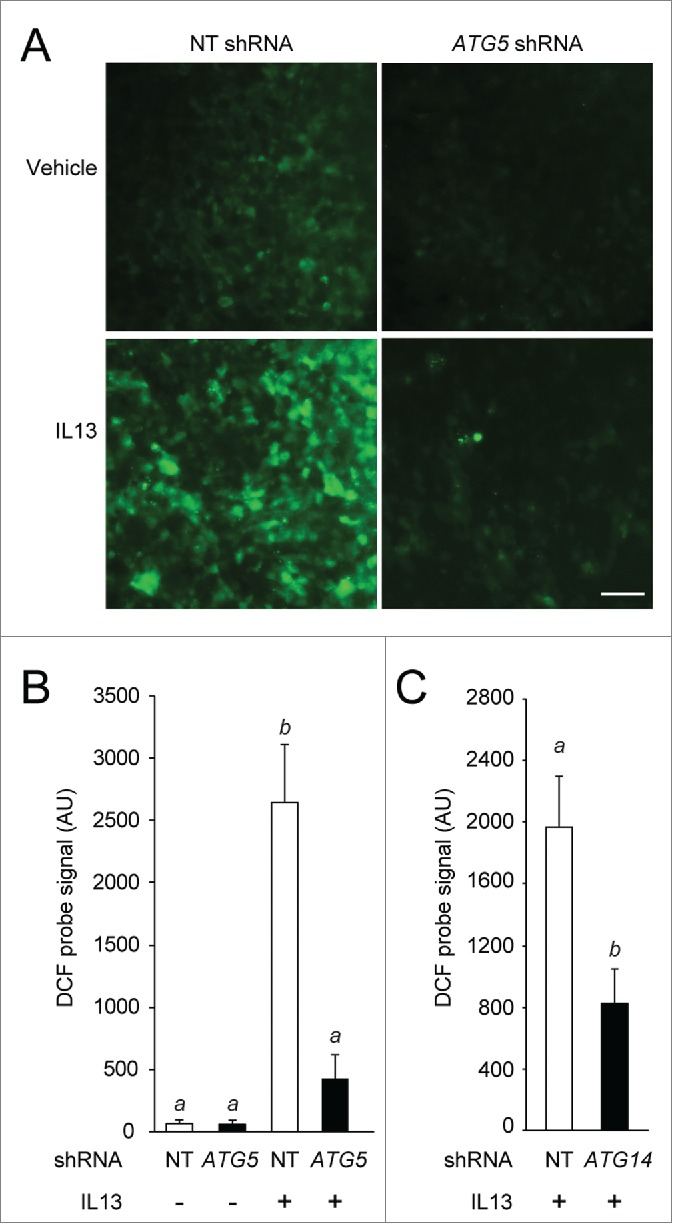
Cytokine modulation of autophagy is increasingly recognized in disease pathogenesis, and current concepts suggest that type 1 cytokines activate autophagy, whereas type 2 cytokines are inhibitory. However, this paradigm derives primarily from studies of immune cells and is poorly characterized in tissue cells, including sentinel epithelial cells that regulate the immune response. In particular, the type 2 cytokine IL13 (interleukin 13) drives the formation of airway goblet cells that secrete excess mucus as a characteristic feature of airway disease, but whether this process is influenced by autophagy was undefined. Here we use a mouse model of airway disease in which IL33 (interleukin 33) stimulation leads to IL13-dependent formation of airway goblet cells as tracked by levels of mucin MUC5AC (mucin 5AC, oligomeric mucus/gel forming), and we show that these cells manifest a block in mucus secretion in autophagy gene Atg16l1-deficient mice compared to wild-type control mice. Similarly, primary-culture human tracheal epithelial cells treated with IL13 to stimulate mucus formation also exhibit a block in MUC5AC secretion in cells depleted of autophagy gene ATG5 (autophagy-related 5) or ATG14 (autophagy-related 14) compared to nondepleted control cells. Our findings indicate that autophagy is essential for airway mucus secretion in a type 2, IL13-dependent immune disease process and thereby provide a novel therapeutic strategy for attenuating airway obstruction in hypersecretory inflammatory diseases such as asthma, chronic obstructive pulmonary disease, and cystic fibrosis lung disease. Taken together, these observations suggest that the regulation of autophagy by Th2 cytokines is cell-context dependent.
Keywords: IL13; MUC5AC; airway epithelial cells; autophagy; reactive oxygen species; secretion.
Figures


Similar articles
-
IL-13-induced MUC5AC production and goblet cell differentiation is steroid resistant in human airway cells.Clin Exp Allergy. 2011 Dec;41(12):1747-56. doi: 10.1111/j.1365-2222.2011.03852.x. Epub 2011 Sep 20. Clin Exp Allergy. 2011. PMID: 22092504
-
Interleukin-9 upregulates mucus expression in the airways.Am J Respir Cell Mol Biol. 2000 Jun;22(6):649-56. doi: 10.1165/ajrcmb.22.6.3927. Am J Respir Cell Mol Biol. 2000. PMID: 10837360
-
Complement C3a regulates Muc5ac expression by airway Clara cells independently of Th2 responses.Am J Respir Crit Care Med. 2007 Jun 15;175(12):1250-8. doi: 10.1164/rccm.200701-049OC. Epub 2007 Mar 30. Am J Respir Crit Care Med. 2007. PMID: 17400733 Free PMC article.
-
Treatment of airway mucus hypersecretion.Ann Med. 2006;38(2):116-25. doi: 10.1080/07853890600585795. Ann Med. 2006. PMID: 16581697 Review.
-
New pharmacotherapy for airway mucus hypersecretion in asthma and COPD: targeting intracellular signaling pathways.J Aerosol Med Pulm Drug Deliv. 2010 Aug;23(4):219-31. doi: 10.1089/jamp.2009.0802. J Aerosol Med Pulm Drug Deliv. 2010. PMID: 20695774 Review.
Cited by
-
Sodium channel TRPM4 and sodium/calcium exchangers (NCX) cooperate in the control of Ca2+-induced mucin secretion from goblet cells.J Biol Chem. 2019 Jan 18;294(3):816-826. doi: 10.1074/jbc.RA117.000848. Epub 2018 Nov 27. J Biol Chem. 2019. PMID: 30482841 Free PMC article.
-
Autophagy proteins are required for club cell structure and function in airways.Am J Physiol Lung Cell Mol Physiol. 2019 Aug 1;317(2):L259-L270. doi: 10.1152/ajplung.00394.2018. Epub 2019 May 22. Am J Physiol Lung Cell Mol Physiol. 2019. PMID: 31116580 Free PMC article.
-
New insights into autophagy in inflammatory subtypes of asthma.Front Immunol. 2023 Apr 6;14:1156086. doi: 10.3389/fimmu.2023.1156086. eCollection 2023. Front Immunol. 2023. PMID: 37090692 Free PMC article. Review.
-
Programmed Cell Death in Asthma: Apoptosis, Autophagy, Pyroptosis, Ferroptosis, and Necroptosis.J Inflamm Res. 2023 Jul 1;16:2727-2754. doi: 10.2147/JIR.S417801. eCollection 2023. J Inflamm Res. 2023. PMID: 37415620 Free PMC article. Review.
-
Prognostic Significance of Autophagy-Relevant Gene Markers in Colorectal Cancer.Front Oncol. 2021 Apr 15;11:566539. doi: 10.3389/fonc.2021.566539. eCollection 2021. Front Oncol. 2021. PMID: 33937013 Free PMC article.
References
-
- Levine B, Mizushima N, Virgin HW. Autophagy in immunity and inflammation. Nature 2011; 469:323-35; PMID:21248839; http://dx.doi.org/10.1038/nature09782 - DOI - PMC - PubMed
-
- Harris J. Autophagy and cytokines. Cytokine 2011; 56:140-4; PMID:21889357; http://dx.doi.org/10.1016/j.cyto.2011.08.022 - DOI - PubMed
-
- Delgado MA, Elmaoued RA, Davis AS, Kyei G, Deretic V. Toll-like receptors control autophagy. EMBO J 2008; 27:1110-21; PMID:18337753; http://dx.doi.org/10.1038/emboj.2008.31 - DOI - PMC - PubMed
-
- Travassos LH, Carneiro LA, Ramjeet M, Hussey S, Kim YG, Magalhaes JG, Yuan L, Soares F, Chea E, Le Bourhis L, et al.. Nod1 and Nod2 direct autophagy by recruiting ATG16L1 to the plasma membrane at the site of bacterial entry. Nat Immunol 2010; 11:55-62; PMID:19898471; http://dx.doi.org/10.1038/ni.1823 - DOI - PubMed
-
- Martinet W, De Meyer GR. Autophagy in atherosclerosis: a cell survival and death phenomenon with therapeutic potential. Circ Res 2009; 104:304-17; PMID:19213965; http://dx.doi.org/10.1161/CIRCRESAHA.108.188318 - DOI - PubMed
Publication types
MeSH terms
Substances
Grants and funding
LinkOut - more resources
Full Text Sources
Other Literature Sources