. 2015 Jul 15;195(2):587-601.
doi: 10.4049/jimmunol.1402545. Epub 2015 Jun 10.

Functional Heterogeneity and Antimycobacterial Effects of Mouse Mucosal-Associated Invariant T Cells Specific for Riboflavin Metabolites

Affiliations

Functional Heterogeneity and Antimycobacterial Effects of Mouse Mucosal-Associated Invariant T Cells Specific for Riboflavin Metabolites

Isaac G Sakala et al. J Immunol. .

Abstract

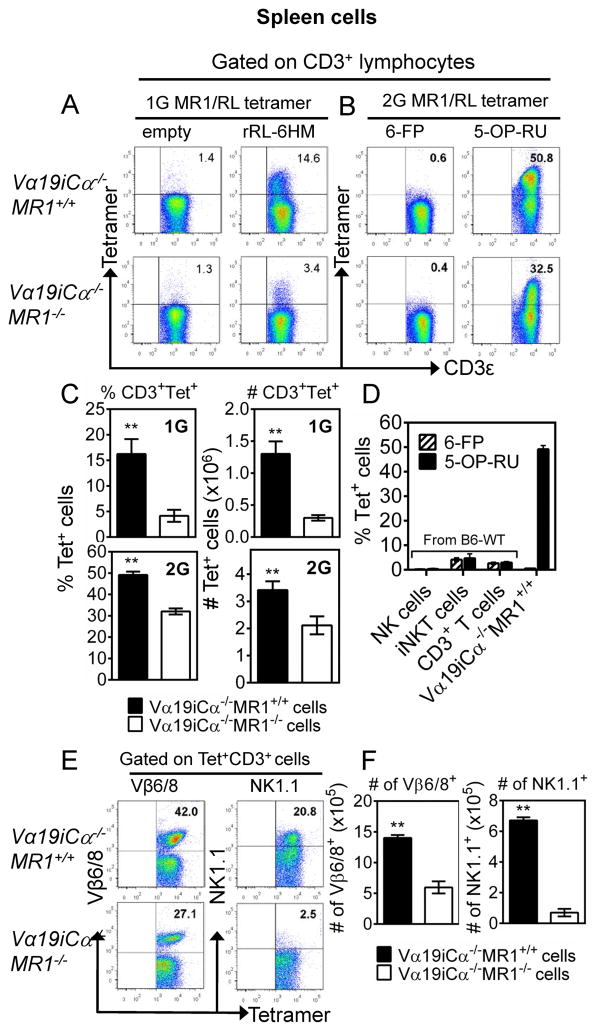
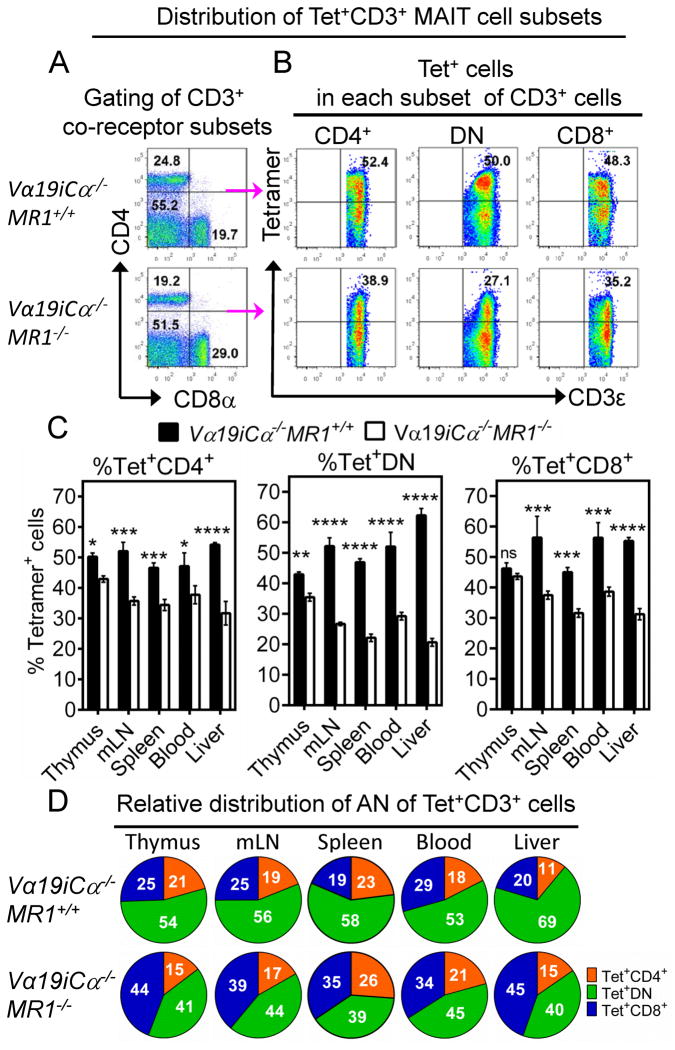
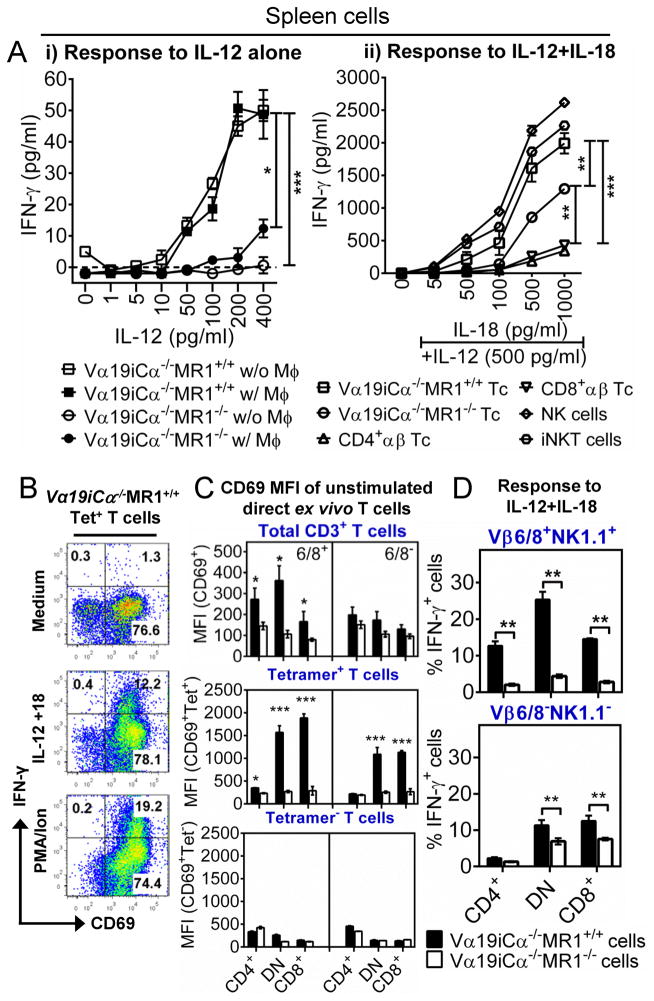
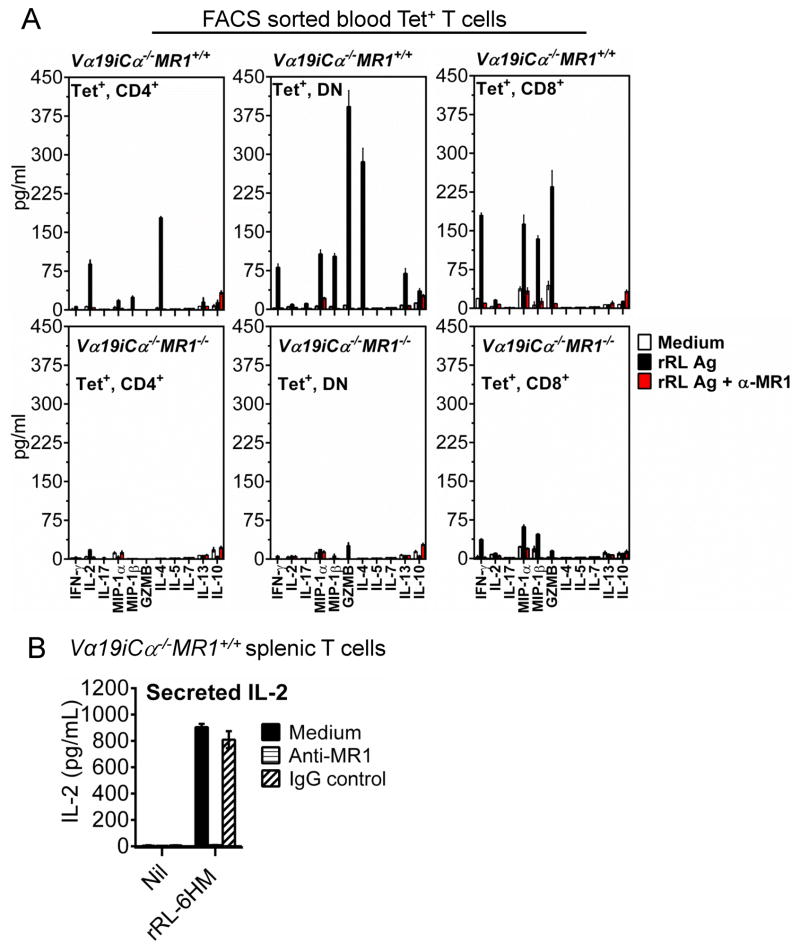
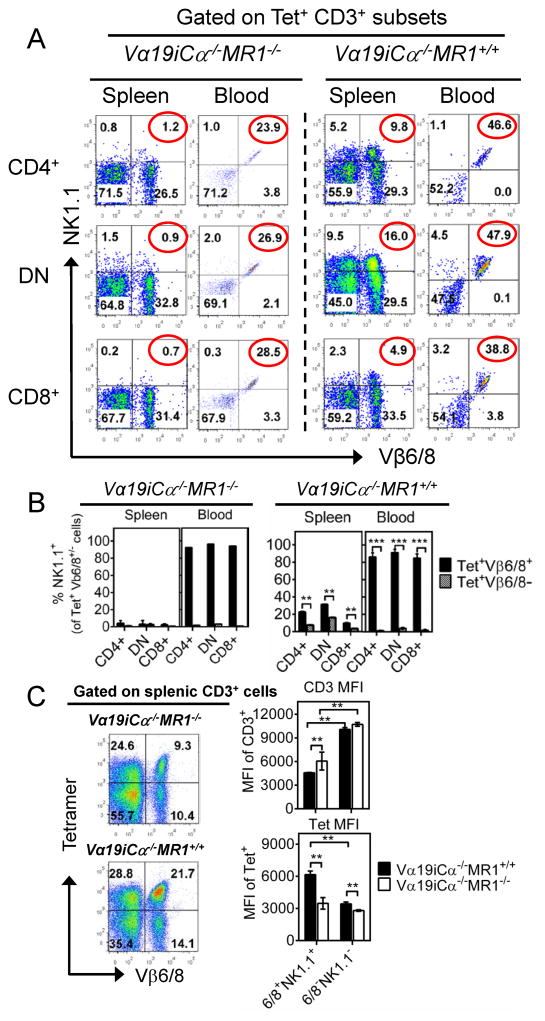
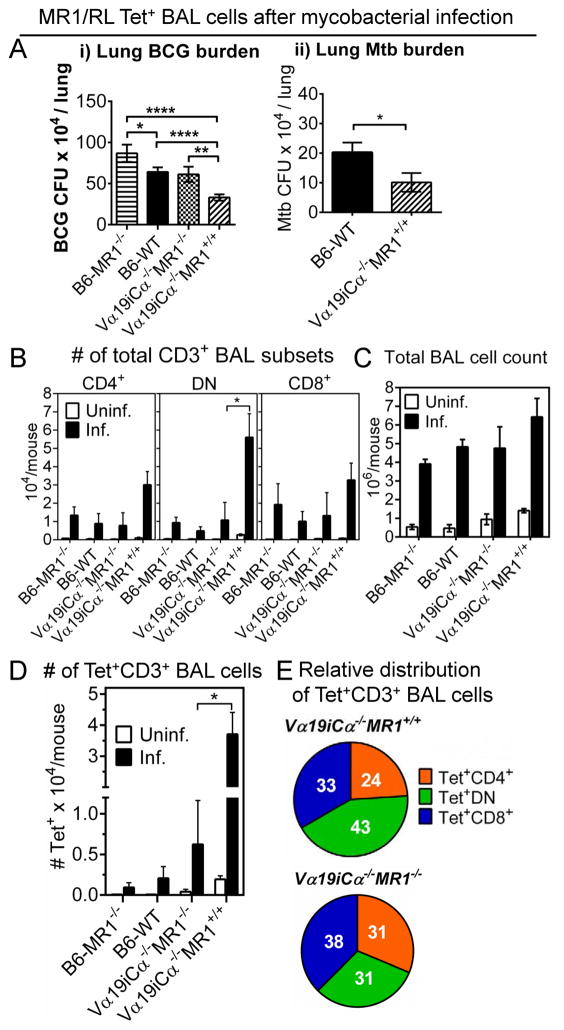
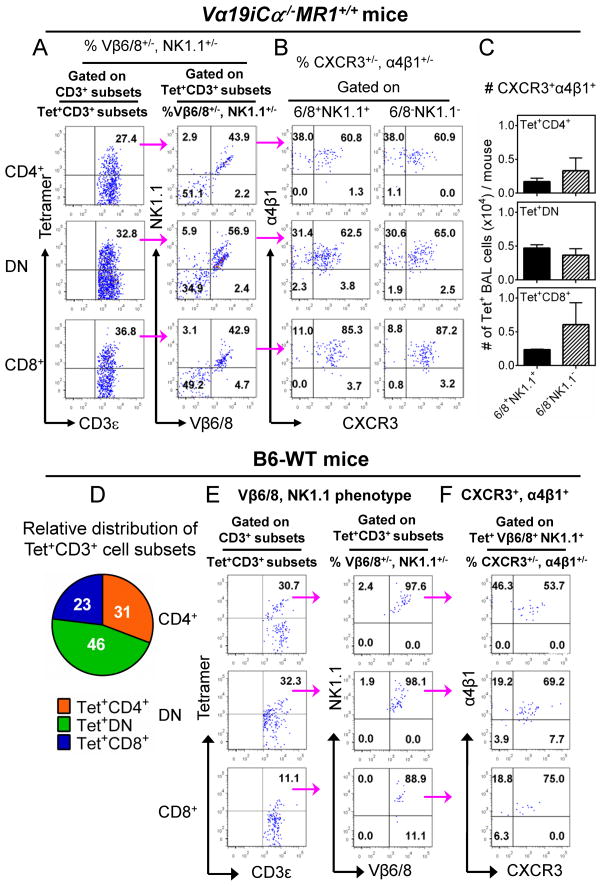
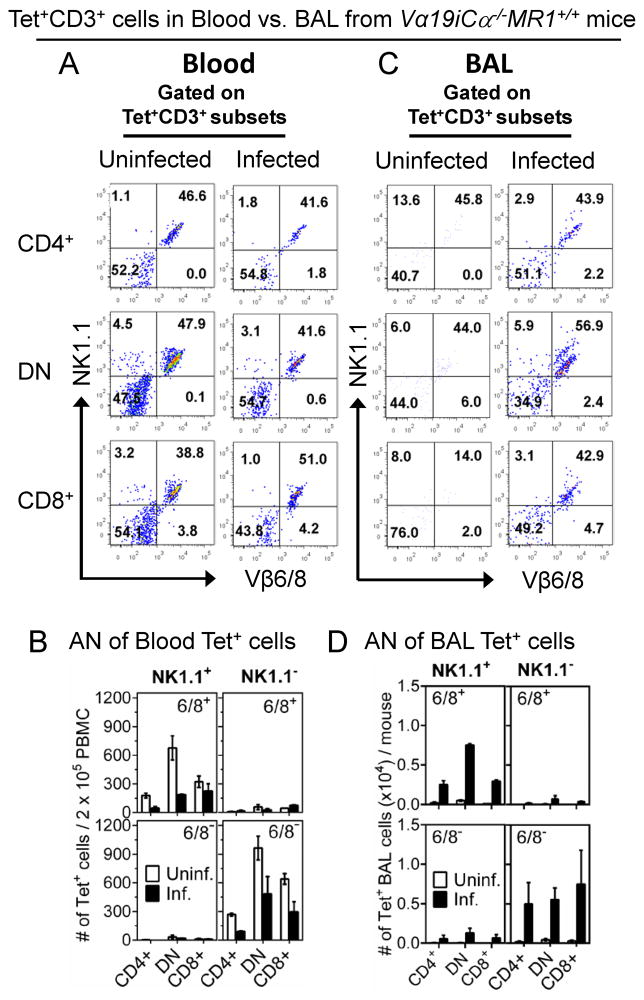
Mucosal-associated invariant T (MAIT) cells have a semi-invariant TCR Vα-chain, and their optimal development is dependent upon commensal flora and expression of the nonpolymorphic MHC class I-like molecule MR1. MAIT cells are activated in an MR1-restricted manner by diverse strains of bacteria and yeast, suggesting a widely shared Ag. Recently, human and mouse MR1 were found to bind bacterial riboflavin metabolites (ribityllumazine [RL] Ags) capable of activating MAIT cells. In this study, we used MR1/RL tetramers to study MR1 dependency, subset heterogeneity, and protective effector functions important for tuberculosis immunity. Although tetramer(+) cells were detected in both MR1(+/+) and MR1(-/-) TCR Vα19i-transgenic (Tg) mice, MR1 expression resulted in significantly increased tetramer(+) cells coexpressing TCR Vβ6/8, NK1.1, CD44, and CD69 that displayed more robust in vitro responses to IL-12 plus IL-18 and RL Ag, indicating that MR1 is necessary for the optimal development of the classic murine MAIT cell memory/effector subset. In addition, tetramer(+) MAIT cells expressing CD4, CD8, or neither developing in MR1(+/+) Vα19i-Tg mice had disparate cytokine profiles in response to RL Ag. Therefore, murine MAIT cells are considerably more heterogeneous than previously thought. Most notably, after mycobacterial pulmonary infection, heterogeneous subsets of tetramer(+) Vα19i-Tg MAIT cells expressing CXCR3 and α4β1 were recruited into the lungs and afforded early protection. In addition, Vα19iCα(-/-)MR(+/+) mice were significantly better protected than were Vα19iCα(-/-)MR1(-/-), wild-type, and MR1(-/-) non-Tg mice. Overall, we demonstrate considerable functional diversity of MAIT cell responses, as well as that MR1-restricted MAIT cells are important for tuberculosis protective immunity.


Conflict of interest statement

Disclosures

The authors have no financial conflict of interest.

Figures

FIGURE 1
FIGURE 1
Mouse MR1/RL tetramers stain phenotypically diverse subsets of CD3+ cells in Vα19i Tg mice on both MR1+/+ and MR1−/− genetic background. Purified splenic T cells from antigen-naïve Vα19iCα−/−MR1+/+ or Vα19iCα−/−MR1−/− mice were stained with anti-mouse CD3ε, CD4, CD8α, NK1.1 (clone PK136), Vβ6/8.1-2 TCR and mouse MR1 tetramers, and analysed by flow cytometry. (A) Representative FACS plots of CD3ε (X-axis) vs. tetramer (Y-axis) gated on splenic CD3+ lymphocyte population for CD3+ T cells stained with first generation (1G) mouse MR1 tetramers loaded with “empty” as negative control or loaded with antigenic rRL-6HM. (B) Representative FACS plots of splenic CD3+ T cells stained with second generation (2G) mouse MR1 tetramers, loaded with non-antigenic 6-FP as negative control or loaded with antigenic 5-OP-RU. The percentages of stained cells are indicated. (C, top panel) Percentages (left bar graph) and absolute numbers (AN) (right bar graph) of 1G tetramer+ CD3+ cells in Vα19iCα−/−MR1+/+ or Vα19iCα−/−MR1−/− mice. (C, bottom panel) Percentages (left bar graph) and AN (right bar graph) of 2G tetramer+ CD3+ cells in Vα19iCα−/−MR1+/+ or Vα19iCα−/−MR1−/− mice. (D) Shown is staining of purified splenic NK, type I NKT and bulk T cells from non-transgenic wild type B6 mice with murine MR1–6-FP or MR1–5-OP-RU tetramers, compared with Vα19iCα−/−MR1+/+ T cells. (E) Representative FACS plots of percentage Vβ6/8+ (left panel) or NK1.1 (right panel) of 2G tetramer+CD3+ T cells in Vα19iCα−/−MR1+/+ or Vα19iCα−/−MR1−/− mice. (F) AN of Vβ6/8+ (right panel) or NK1.1+ (right panel) of 2G tetramer+ CD3+ T cells in Vα19iCα−/−MR1+/+ or Vα19iCα−/−MR1−/− mice. Data shown are representative of three separate experiments. P values are obtained by Mann-Whitney U-tests (n = 5/group) (**p<0.01).
FIGURE 2
FIGURE 2
Frequency of CD3+ tetramer+ MAIT cell subsets in the thymus (CD3high thymocytes), mLN, spleen, blood and liver in Vα19iCα−/−MR1+/+ or Vα19iCα−/−MR1−/− mice. (A) Representative FACS plots of CD4 vs. CD8α gated on CD3+ lymphocyte population for CD4CD8 (DN), CD4+CD8 and CD4CD8+ co-receptor CD3+ subsets in the spleen of Vα19iCα−/−MR1+/+ or Vα19iCα−/−MR1−/− mice. (B) Staining of tetramer+ cells among CD4+ (left plots), DN (centre plots) or CD8+ (right plots) CD3+ splenocytes from Vα19iTgMR1+/+ (top panels) or Vα19iCα−/−MR1−/− (bottom panels) mice. (C) Percentages of tetramer+ CD4+ T cells (left panel), tetramer+ DN T cells (middle panel) and tetramer+ CD8+ T cells (right panel) in the indicated tissues are shown. (D) Pie charts comparing the relative distribution of absolute numbers of tetramer+ CD3+ T cell subsets in the indicated tissues of Vα19iCα−/−MR1+/+ (top panel) or Vα19iCα−/−MR1−/− (bottom panel) mice. Data shown are from more than three separate experiments. P values (obtained using Mann-Whitney U-test and 2way ANOVA (multiple comparison test)) denote comparison of mean differences ± SEM of % tetramer+ cells between Vα19iCα−/−MR1+/+ and Vα19iCα−/−MR1−/− mice. *p<0.05; **p<0.01 and ***p<0.001, ****p<0.0001.
FIGURE 3
FIGURE 3
Responsiveness of Vα19i transgenic T cells to IL-12 and IL-18 combination. (A-i) Splenic T cells from naïve Vα19iCα−/−MR1+/+ or Vα19iCα−/−MR1−/− mice were stimulated with indicated doses of IL-12 alone in the presence or absence of BMDMϕ (w/Mϕ or w/o Mϕ, respectively). Data shown are from one of two independent experiments with similar results. (A-ii) Splenic T cells (Tc) from naïve Vα19iCα−/−MR1+/+ or Vα19iCα−/−MR1−/− mice, conventional CD4+ and CD8+ αβ T cells, type I NKT (iNKT) and NK cells from naïve B6-WT mice were stimulated with 500 pg/ml IL-12 plus IL-18 (5pg/ml – 1000pg/ml) in the absence of BMDMϕ for 24h. IFN-γ in triplicate culture supernatants were determined by ELISA. (B) FACS plots showing percentage of intracellular IFN-γ produced by activated (CD69+) sort-purified tetramer+ T cells after 24h stimulation with 500 pg/ml IL-12 plus 1000 pg/ml IL-18. Data shown are representative of three experiments with similar results. (C) Data from two separate experiments showing mean fluorescent intensities for CD69 staining on Vβ6/8+ and Vβ6/8 bulk Vα19i T cells (top panel), FACS sorted tetramer+ cells (middle panel) or FACS sorted tetramer cells (bottom panel), from naïve Vα19iCα−/−MR1+/+ or Vα19iCα−/−MR1−/− mice. (D) Shown is percentage of intracellular IFN-γ produced by tetramer+ Vβ6/8+NK1.1+ cells (top panel) or tetramer+ Vβ6/8NK1.1 cells (bottom panel) after 24h stimulation with 500 pg/ml IL-12 plus 1000 pg/ml IL-18. Tetramer+ Vβ6/8+NK1.1+ cells are the best responder subset to IL-12 plus IL-18, and the response depends on the presence of MR1 during development. P values (unpaired 2-tailed t test) in comparison are *p<0.05; **p<0.01 and ***p<0.001.
FIGURE 4
FIGURE 4
Vα19iCα−/−MR1+/+ T cells respond to RL antigen better than Vα19iTgMR1−/− T cells. (A) Peripheral blood mononuclear cells (PBMC) from twenty two (22) Vα19iCα−/−MR1+/+ (upper panel) or Vα19iCα−/−MR1−/− (bottom panel) mice were stained with antibodies specific for CD3ε, CD4, CD8α and MR1/RL tetramer, and tetramer+ cells sorted by FACS. Sorted tetramer+ cells were rested overnight in medium and then co-cultured in triplicates (2.5 × 10³ cells/well) with CH27-mMR1 APCs (500 cells/well) along with medium alone, rRL-6HM (rRL) antigen or rRL Ag plus 10μg/ml anti-MR1 for 60h at 37°C. The indicated cytokines, chemokines and GZMB were measured in supernatants using Multiplex bead array assays according to manufacturer’s instructions (Milliplex MAP Assays from EMD Millipore). Tetramer+ Vα19iCα−/−MR1+/+ T cells are functionally capable MAIT cells. (B) Anti-MR1 antibody, but not mouse IgG isotype control, specifically blocks Ag presentation by APC. Shown is the activation of Vα19iCα−/−MR1+/+ T cells by rRL-6HM Ag. Purified MR1+/+ splenic Vα19i Tg T cells (2 × 10⁵/well) were co-cultured with CH27-mMR1 APCs (4 × 10⁴ cells/well) along with nothing (Nil) or 76.2 μM (final concentration) rRL-6HM in triplicate wells. APCs and Tg T cells were co-cultured overnight (24h) at 37°C in the absence or presence of anti-MR1 blocking antibodies or mouse IgG isotype control. MAIT cell activation was determined by IL-2 secretion using ELISA.
FIGURE 5
FIGURE 5
Peripheral expansion of Vβ6/8+NK1.1+ population of tetramer+ CD3+ T cells in Vα19i Tg mice. (A) Shows surface Vβ6/8.1-2 (X-axis) and NK1.1 (Y-axis) expression on tetramer+ CD4+ (top plots), DN (middle plots) or CD8+ (bottom plots) T cells in spleen and blood from uninfected Vα19iCα−/−MR1−/− (left panel) Vα19iCα−/−MR1+/+ (right panel) mice. Numbers in the upper right quadrants are NK1.1+ and Vβ6/8.1-2+ cells. (B) Increasing enrichment of tetramer+ NK1.1 lineage in Vβ6/8+ cells more than in Vβ6/8 subset from spleen to blood. (C) Vα19i Tg cells developing with MR1 have higher affinity for MR1/RL complexes. Shown in the left panel are Vβ6/8 (X-axis) vs. tetramer (Y-axis) FACS plots of splenic CD3+ MAIT cells from Vα19iCα−/−MR1−/−or Vα19iCα−/−MR1+/+ mice. Shown in the right panel are mean fluorescence intensities of CD3ε (top bar graph) and tetramer (bottom bar graph) staining of splenic tetramer+ Vβ6/8+NK1.1+ or Vβ6/8NK1.1 CD3+ T cells from Vα19iCα−/−MR1+/+ or Vα19iCα−/−MR1−/− mice. Despite lower CD3 expression, Vα19i Tg T cells from MR1+/+ mice display higher affinity for MR1/RL tetramers than Vα19i Tg cells from MR1−/− mice. Furthermore, tetramer+ CD3+ MAIT cells expressing both Vβ6/8 and NK1.1 in Vα19i Tg MR1 sufficient mice display the highest affinity for tetramer binding. Data shown are from two separate experiments. P values are obtained by Mann-Whitney U-tests (n = 5/group) (**p<0.01 and ***p<0.001).
FIGURE 6
FIGURE 6
MR1/RL tetramer+ T cells accumulate in the lung during mycobacteria primary infection. Groups of 5 - 11 B6-MR1−/−, B6-WT, Vα19iCα−/−MR1−/− or Vα19iCα−/−MR1+/+ mice were infected with M. bovis BCG Danish or M. tuberculosis Erdman as described in the Materials and Methods. At day 10 post-infection, BAL fluids collected from uninfected and infected groups were pooled for staining with tetramer and other phenotypic markers. The bacterial burden was determined by CFU plating of lung tissue homogenates. (A) Bar graphs showing M. bovis BCG Danish (i) and M. tuberculosis Erdman CFUs (ii) in lungs of infected mice. Results are mean ± SEM of mycobacteria CFUs, and are from three independent experiments. (B) Absolute numbers (AN) of BAL CD3+ lymphocytes in uninfected or infected mice. (C) Data from three independent experiments showing total leukocyte counts in BAL fluids from uninfected and infected mice. (D) Bar graphs showing AN of BAL tetramer+ CD3+ T cells in the indicated mice. (E) Pie charts showing relative distribution of absolute numbers of tetramer+ CD3+ MAIT cell subsets in infected Vα19iCα−/−MR1+/+ (top pie chart) or Vα19iCα−/−MR1−/− (bottom pie chart) mice. P values were obtained by using Mann Whitney U test (*p<0.05; **p<0.01, and ****p<0.0001).
FIGURE 7
FIGURE 7
Vβ6/8 and NK1.1 expression by BAL tetramer+ CD3+ MAIT cells in Vα19iCα−/−MR1+/+ and B6-WT mice after mycobacterial infection. (A – C) Phenotype of tetramer+ CD3+ MAIT cell subsets in BAL fluids from infected Vα19iCα−/−MR1+/+ mice. (A) (Left column) Representative FACS plots from three separate experiments showing percentages of tetramer+ CD3+ Vα19i Tg T cell subsets. The numbers in the upper right quadrants indicate tetramer+ CD4+ (top plot), tetramer+ DN (middle plot) and tetramer+ CD8+ (bottom plot) MAIT cells. (Right column) Representative plots showing Vβ6/8.1-2 (X-axis) and NK1.1 (Y-axis) expression on tetramer+ CD4+ (top plot), DN (middle plot) or CD8+ (bottom plot) MAIT cells. The numbers in the quadrants indicate i) NK1.1Vβ6/8.1-2 tetramer+ cells (lower left quadrats), ii) NK1.1+ Vβ6/8.1-2 tetramer+ cells (upper left quadrats), iii) NK1.1+Vβ6/8.1-2+ tetramer+ cells (upper right quadrats) and iv) NK1.1 Vβ6/8.1-2+ tetramer+ cells (lower right quadrats). The NK1.1 Vβ6/8 tetramer+ and NK1.1+Vβ6/8+ cells were the most predominant subpopulations. (B) Representative data from three separate experiments showing percentage of CXCR3 (X-axis) and α4β1 (Y-axis) expression on NK1.1+Vβ6/8+ or NK1.1Vβ6/8 tetramer+ CD4+ (top plots), DN (middle plots) or CD8+ (bottom plots) MAIT cells in BAL from infected Vα19iCα−/−MR1+/+ mice. Numbers in the upper right quadrants are proportions of cells that expressed both CXCR3 and α4β1 integrin. (C) Representative data from three separate experiments showing AN of CXCR3 and α4β1-expressing NK1.1+Vβ6/8+ or NK1.1 Vβ6/8 tetramer+ CD4+ (top bar), DN (middle bar) or CD8+ (bottom bar) MAIT cells. (D – F) Frequency and phenotype of tetramer+ CD3+ non-Tg MAIT cell subsets in BAL fluids from infected B6-WT mice. (D) The pie chart shows the relative distribution of absolute numbers of tetramer+ CD3+ MAIT cell subsets in the BAL fluids from infected B6-WT mice. (E) (Left column) Representative FACS plots showing percentages of tetramer+ CD3+ MAIT cell subsets. Numbers in the upper right quadrants indicate tetramer+ CD4+ (top plot), tetramer+ DN (middle plot) and tetramer+ CD8+ (bottom plot) MAIT cells. (Right column) Representative FACS plots showing Vβ6/8 (X-axis) and NK1.1 (Y-axis) expression on tetramer+ CD3+ MAIT cell subsets. Numbers in the upper right quadrants are proportions of tetramer+ cells that expressed both Vβ6/8 and NK1.1, and (F) CXCR3 and α4β1 integrin expression on Vβ6/8+NK1.1+ tetramer+ MAIT cell population in the airways of infected B6-WT mice.
FIGURE 8
FIGURE 8
Vβ6/8 and NK1.1 phenotype of Vα19i Tg T cells in blood and BAL from uninfected or mycobacterial-infected Vα19iCα−/−MR1+/+ mice. Vα19iCα−/−MR1+/+ mice were infected with 107 CFU/mouse of BCG Danish as described in Fig. 6. At day 10 post-infection peripheral blood T cells were stained with tetramer and a panel of other phenotypic markers and analysed by FACS. (A) FACS plots from one of the two separate experiments showing percentages of Vβ6/8.1-2 (X-axis) and NK1.1 (Y-axis) expression on tetramer+ CD4+ (top plots), DN (middle plots) or CD8+ (bottom plots) MAIT cells in blood from uninfected or infected Vα19iCα−/−MR1+/+ mice. (B) Data from two separate experiments showing number of tetramer+ NK1.1+ or tetramer+ NK1.1 cells that were either Vβ6/8+ (top panels) or Vβ6/8 (bottom panel) cells in blood from uninfected or infected Vα19iCα−/−MR1+/+ mice. (C) Representative data from one of the three separate experiments showing percentages of Vβ6/8.1-2 and NK1.1 expression on tetramer+ CD4+ (top plots), DN (middle plots) or CD8+ (bottom plots) MAIT cells in BAL from uninfected or infected Vα19iCα−/−MR1+/+ mice. (D) Data from two separate experiments showing number of tetramer+ NK1.1+ or tetramer+ NK1.1 cells that were either Vβ6/8+ (top panels) or Vβ6/8 (bottom panel) cells in BAL from uninfected or infected Vα19iCα−/−MR1+/+ mice.

Similar articles

Cited by

References

    1. Hashimoto K, Hirai M, Kurosawa Y. A gene outside the human MHC related to classical HLA class I genes. Science. 1995;269:693–695. - PubMed
    1. Kjer-Nielsen L, Patel O, Corbett AJ, Le Nours J, Meehan B, Liu L, Bhati M, Chen Z, Kostenko L, Reantragoon R, Williamson NA, Purcell AW, Dudek NL, McConville MJ, O’Hair RA, Khairallah GN, Godfrey DI, Fairlie DP, Rossjohn J, McCluskey J. MR1 presents microbial vitamin B metabolites to MAIT cells. Nature. 2012;491:717–723. - PubMed
    1. Patel O, Kjer-Nielsen L, Le Nours J, Eckle SB, Birkinshaw R, Beddoe T, Corbett AJ, Liu L, Miles JJ, Meehan B, Reantragoon R, Sandoval-Romero ML, Sullivan LC, Brooks AG, Chen Z, Fairlie DP, McCluskey J, Rossjohn J. Recognition of vitamin B metabolites by mucosal-associated invariant T cells. Nature communications. 2013;4:2142. - PubMed
    1. Reantragoon R, Corbett AJ, Sakala IG, Gherardin NA, Furness JB, Chen Z, Eckle SB, Uldrich AP, Birkinshaw RW, Patel O, Kostenko L, Meehan B, Kedzierska K, Liu L, Fairlie DP, Hansen TH, Godfrey DI, Rossjohn J, McCluskey J, Kjer-Nielsen L. Antigen-loaded MR1 tetramers define T cell receptor heterogeneity in mucosal-associated invariant T cells. The Journal of experimental medicine. 2013;210:2305–2320. - PMC - PubMed
    1. Birkinshaw RW, Kjer-Nielsen L, Eckle SB, McCluskey J, Rossjohn J. MAITs, MR1 and vitamin B metabolites. Current opinion in immunology. 2014;26:7–13. - PubMed

Publication types

MeSH terms