Comparative Study
. 2015 Jun;5(6):150047.
doi: 10.1098/rsob.150047.

Warburg Micro syndrome is caused by RAB18 deficiency or dysregulation

Affiliations
Comparative Study

Warburg Micro syndrome is caused by RAB18 deficiency or dysregulation

Mark T Handley et al. Open Biol. 2015 Jun.

Abstract

RAB18, RAB3GAP1, RAB3GAP2 and TBC1D20 are each mutated in Warburg Micro syndrome, a rare autosomal recessive multisystem disorder. RAB3GAP1 and RAB3GAP2 form a binary 'RAB3GAP' complex that functions as a guanine-nucleotide exchange factor (GEF) for RAB18, whereas TBC1D20 shows modest RAB18 GTPase-activating (GAP) activity in vitro. Here, we show that in the absence of functional RAB3GAP or TBC1D20, the level, localization and dynamics of cellular RAB18 is altered. In cell lines where TBC1D20 is absent from the endoplasmic reticulum (ER), RAB18 becomes more stably ER-associated and less cytosolic than in control cells. These data suggest that RAB18 is a physiological substrate of TBC1D20 and contribute to a model in which a Rab-GAP can be essential for the activity of a target Rab. Together with previous reports, this indicates that Warburg Micro syndrome can be caused directly by loss of RAB18, or indirectly through loss of RAB18 regulators RAB3GAP or TBC1D20.

Keywords: GAP; GEF; RAB18; Rab; Ras.


Figures
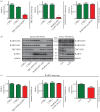
Figure 1.
Figure 1.
Loss-of-function mutations in TBC1D20 or RAB3GAP1 are associated with increased levels of RAB18 protein but not transcript. (a) Quantitative RT-PCR (qPCR) shows that levels of TBC1D20 and RAB3GAP transcripts are reduced compared to controls in TBC1D20(p.Gln98*) and RAB3GAP1(c.649-2A>G) patient fibroblasts, respectively, but that levels of RAB18 transcript in RAB18(p.Leu24Gln) fibroblasts are comparable. (b) Western blotting shows levels of RAB3GAP1, RAB3GAP2, TBC1D20 and RAB18 protein in control and patient fibroblasts and blind-sterile fibroblasts. Blotting for tubulin serves as a control. Each lane on the blots shown corresponds to an individual lysate sample, and each blot is representative of at least three independent experiments. (c) qPCR shows that levels of RAB18 transcript are comparable in control and mutant cell lines. qPCR data shown are derived from analysis of at least three cDNAs per genotype, each analysed in triplicate. Primers were designed using the Universal ProbeLibrary Assay Design Center (Roche) and are listed in the electronic supplementary material, table S1. Error bars represent s.e.m. *p < 0.005, unpaired Student's t-test.
Figure 2.
Figure 2.
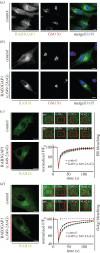
RAB18 dynamics at the Golgi are altered in RAB3GAP1(c.649-2A>G) fibroblasts. (a) RAB3GAP1 colocalizes with staining for GM130 in control human fibroblasts. (b) GFP-RAB18 colocalizes with staining for GM130 in control and RAB3GAP1(c.649-2A>G) fibroblasts. (c) GFP-RAB18 dynamics at the ER in control and RAB3GAP1(c.649-2A>G) fibroblasts. (d) GFP-RAB18 dynamics at the Golgi in control and RAB3GAP1(c.649-2A>G) fibroblasts. Indicated ROIs in each cell were bleached with high-intensity laser. Fluorescence recovery in the ROI was recorded over time and normalized with respect to overall cell fluorescence. Data were combined from at least 15 cells per condition and are representative of two independent experiments. Error bars represent s.e.m. Scale bars, 10 µm. #p < 0.05 and *p < 0.01, unpaired Student's t-test.
Figure 3.
Figure 3.
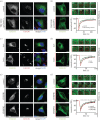
RAB18 dynamics at the ER are altered in TBC1D20(p.Gln98*) patient fibroblasts, bs mEFs and TBC1D20-deficient HeLa cells. (a) GFP-RAB18 colocalizes with staining for GM130 in control but not TBC1D20(p.Gln98*) fibroblasts. (b) GFP-RAB18 dynamics at the ER are altered in TBC1D20(p.Gln98*) fibroblasts when compared with controls. (c) GFP-RAB18 partly colocalizes with staining for GM130 in bs/+ and bs/bs mEFs. (d) GFP-RAB18 dynamics at the ER are altered in bs/bs compared to bs/+ mEFs. (e) GFP-RAB18 partly colocalizes with staining for GM130 in control HeLa cells and in two TBC1D20-deficient HeLa cell lines. (f) GFP-RAB18 dynamics at the ER are comparably altered in two TBC1D20-deficient HeLa cell lines when compared with controls. In the bleaching experiments, indicated ROIs in each cell were bleached with high-intensity laser. Fluorescence recovery in the ROI was recorded over time and normalized with respect to overall cell fluorescence. Data were combined from at least 22, 21 and 31 cells per condition in (b), (d) and (f), respectively, and are representative of at least three independent experiments. Error bars represent s.e.m. Scale bars, 10 µm. #p < 0.05 and *p < 0.01, unpaired Student's t-test.
Figure 4.
Figure 4.
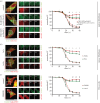
The proportion of cytosolic RAB18 in TBC1D20(p.Gln98*) patient fibroblasts, bs mEFs and TBC1D20-deficient HeLa cells is reduced compared to controls. (a) Loss of cytosolic GFP-RAB18 and mKATE2 fluorescence following permeabilization of human fibroblasts with 10 µM digitonin. Partial loss of GFP-RAB18 fluorescence is comparable in control and RAB3GAP1(c.649-2A>G) cells but reduced in TBC1D20(p.Gln98*) cells. mKATE2 fluorescence is reduced close to background levels in each cell line. (b) Partial loss of GFP-RAB18 fluorescence following digitonin permeabilization is reduced in bs/bs mEFs when compared with bs/+ mEFs (c) Partial loss of GFP-RAB18 fluorescence following digitonin permeabilization is reduced in TBC1D20-deficient HeLa cells when compared with controls. Data were combined from at least 10, 22 and 14 cells per condition in (a), (b) and (c), respectively, and are representative of at least three independent experiments. Error bars represent s.e.m. Scale bars, 10 µm. #p < 0.05 and *p < 0.01, unpaired Student's t-test.
Figure 5.
Figure 5.
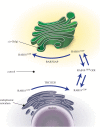
A model for RAB18 regulation. Endoplasmic reticulum (ER)-associated RAB18 hydrolyses bound GTP in a reaction potentiated by TBC1D20 activity. The resulting GDP-bound RAB18 is susceptible to GDP dissociation inhibitor (GDI)-mediated extraction into the cytosol. Cytosolic RAB18 complexed to GDI can be targeted to cellular membrane compartments including the ER and the cis-Golgi. GDP-bound RAB18 associated with the cis-Golgi can exchange bound GDP for GTP in a reaction catalysed by the RAB3GAP complex.

References

    1. Martsolf JT, Hunter AG, Haworth JC. 1978. Severe mental retardation, cataracts, short stature, and primary hypogonadism in two brothers. Am. J. Med. Genet. 1, 291–299. (doi:10.1002/ajmg.1320010305) - DOI - PubMed
    1. Warburg M, Sjo O, Fledelius HC, Pedersen SA. 1993. Autosomal recessive microcephaly, microcornea, congenital cataract, mental retardation, optic atrophy, and hypogenitalism. Micro syndrome. Am. J. Dis. Child. 147, 1309–1312. (doi:10.1001/archpedi.1993.02160360051017) - DOI - PubMed
    1. Aligianis IA, et al. 2005. Mutations of the catalytic subunit of RAB3GAP cause Warburg Micro syndrome. Nat. Genet. 37, 221–223. (doi:10.1038/ng1517) - DOI - PubMed
    1. Bem D, et al. 2011. Loss-of-function mutations in RAB18 cause Warburg Micro syndrome. Am. J. Hum. Genet. 88, 499–507. (doi:10.1016/j.ajhg.2011.03.012) - DOI - PMC - PubMed
    1. Borck G, et al. 2011. A homozygous RAB3GAP2 mutation causes Warburg Micro syndrome. Hum. Genet. 129, 45–50. (doi:10.1007/s00439-010-0896-2) - DOI - PubMed

Publication types

MeSH terms

Supplementary concepts