. 2015 Jun 10;35(23):8737-44.
doi: 10.1523/JNEUROSCI.3789-14.2015.

Disrupting the supplementary motor area makes physical effort appear less effortful

Affiliations

Disrupting the supplementary motor area makes physical effort appear less effortful

Alexandre Zénon et al. J Neurosci. .

Abstract

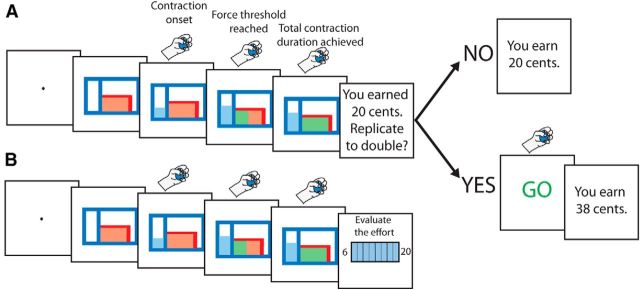
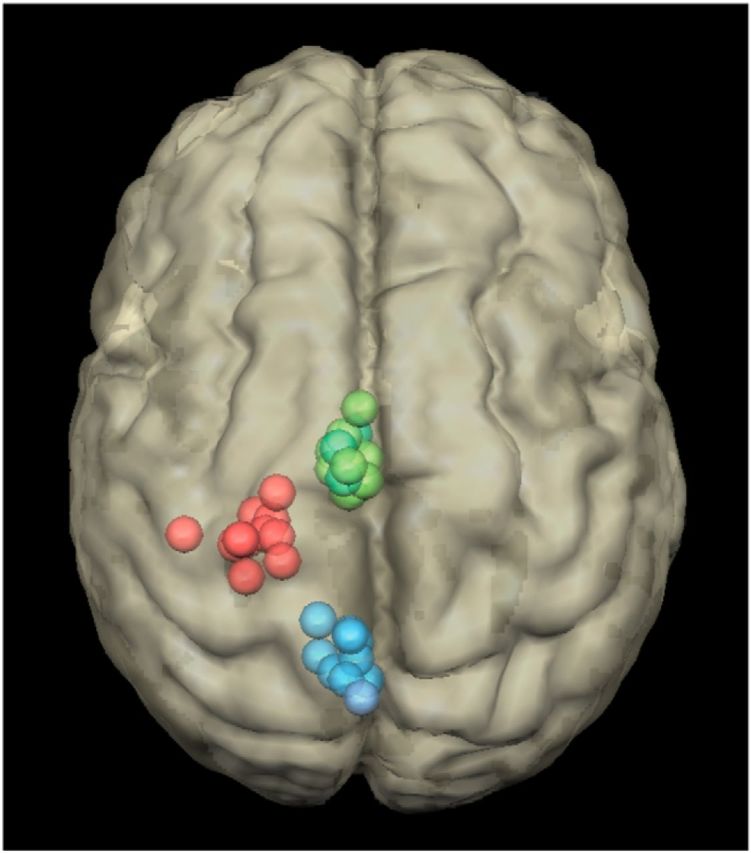
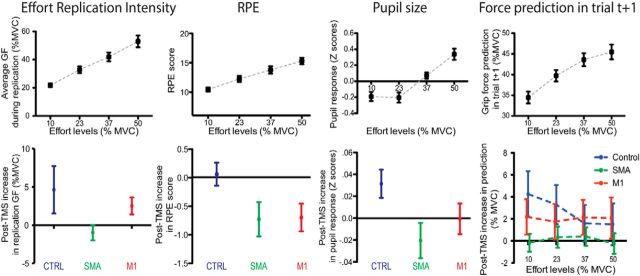
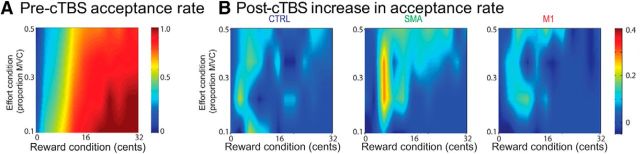
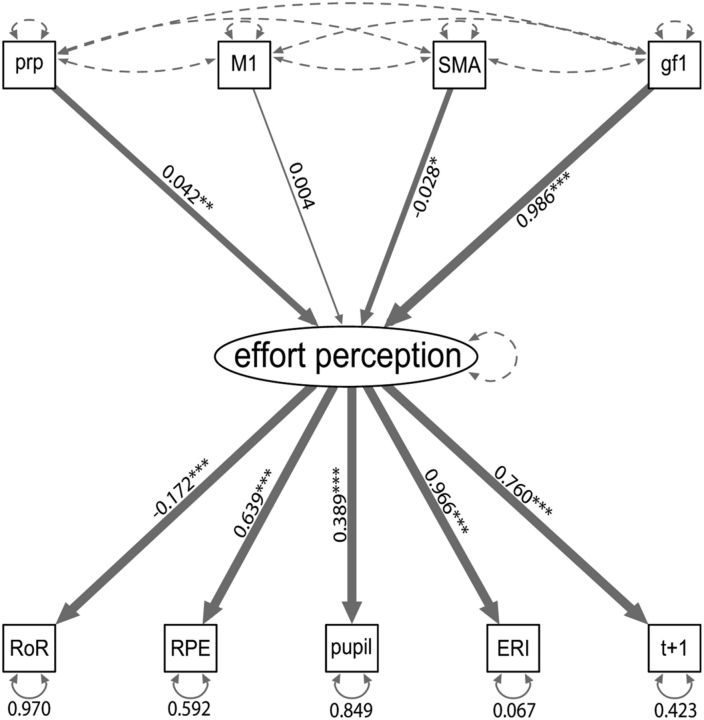
The perception of physical effort is relatively unaffected by the suppression of sensory afferences, indicating that this function relies mostly on the processing of the central motor command. Neural signals in the supplementary motor area (SMA) correlate with the intensity of effort, suggesting that the motor signal involved in effort perception could originate from this area, but experimental evidence supporting this view is still lacking. Here, we tested this hypothesis by disrupting neural activity in SMA, in primary motor cortex (M1), or in a control site by means of continuous theta-burst transcranial magnetic stimulation, while measuring effort perception during grip forces of different intensities. After each grip force exertion, participants had the opportunity to either accept or refuse to replicate the same effort for varying amounts of reward. In addition to the subjective rating of perceived exertion, effort perception was estimated on the basis of the acceptance rate, the effort replication accuracy, the influence of the effort exerted in trial t on trial t+1, and pupil dilation. We found that disruption of SMA activity, but not of M1, led to a consistent decrease in effort perception, whatever the measure used to assess it. Accordingly, we modeled effort perception in a structural equation model and found that only SMA disruption led to a significant alteration of effort perception. These findings indicate that effort perception relies on the processing of a signal originating from motor-related neural circuits upstream of M1 and that SMA is a key node of this network.

Keywords: TMS; cTBS; effort perception; primary motor cortex; supplementary motor area.


Figures

Figure 1.
Figure 1.
Schematic depiction of the task. A, The force level to be reached was indicated by the top bar of the red rectangle shown on the right of the computer screen. When the contraction was initiated, the participants were provided with a feedback about the force being applied in the form of a light blue rectangle shown on the left of the screen, whose height was proportional to the grip force. The feedback was relative to the required grip force, not to its absolute value, such that the top bar of the red rectangle was always at the same level (see Materials and Methods). As soon as the required force was reached, i.e., when the blue rectangle exceeded the top bar of the red rectangle, the red rectangle was progressively filled with green color, at a constant speed. The contraction was completed when the red rectangle was completely filled with green color, which occurred after a total contraction duration of 3 s. In 24 of 28 trials per block, after the first contraction, participants were asked whether they wanted to replicate their effort to double the amount of monetary reward received for the first contraction, which varied pseudo-randomly between trials. The second contraction was performed in the absence of visual feedback. The final reward received depended on the accuracy of the force replication (see Materials and Methods). B, In the remaining four trials of the block (one per effort intensity condition), the participants were asked to rate their subjective perception of the effort exerted during the first contraction on the Rate of Perceived Exertion Scale, which ranges from 6 to 20 (Borg, 1982).
Figure 2.
Figure 2.
Localization of the cTBS sites in the 12 participants for the SMA (green), M1 (red), and control (blue) conditions. These coordinates were obtained by projecting the stimulation sites onto the individual brain MRI of each participant, which was then normalized into the Talairach space.
Figure 3.
Figure 3.
Continuous measurements of effort perception. Each column corresponds to a different effort perception variable. Error bars indicate the SEM. Top row, Relationship between each variable and the effort intensity condition. Bottom row, Changes observed in the four continuous variables after cTBS application to each of the three cTBS sites. Main effects of cTBS sites are illustrated for all variables except the force prediction in trial t+1, in which the EFFORT INTENSITY × cTBS SITE interaction is shown instead, because this was the only significant result obtained from the statistical analysis.
Figure 4.
Figure 4.
Acceptance rate. A, Color plot of the acceptance rate as a function of the REWARD and EFFORT INTENSITY conditions. Color values indicate the acceptance rate, as indicated by the color bar. It can be seen from this plot that the reward condition influenced the acceptance rate more than the effort intensity condition. B, Color plots of the change in acceptance rate after cTBS application in each of the cTBS SITE conditions.
Figure 5.
Figure 5.
Schema of the structural equation model. Top variables correspond to the exogenous, or independent, variables (prp differentiates between the data collected before and after cTBS, M1 indicates data collected after M1 cTBS, SMA indicates data collected after SMA cTBS, and gf1 is the average force exerted during the first contraction). The middle ellipse corresponds to the latent effort perception variable, which is not directly observed but constructed on the basis of the covariance between the five observed variables represented on the bottom of the figure (RoR, rate of replication; pupil, pupil size; t+1, force prediction at trial t+1). The numbers indicated next to the arrows represent standardized path coefficients, and their level of significance is indicated by the thickness of the corresponding arrow and by the number of asterisks (*p ≤ 0.05; **p ≤ 0.01; ***p ≤ 0.001). Loop arrows represent variance parameters, and dashed lines illustrate fixed variances/covariances. The direction of the arrows follows the standard convention for the graphical representation of structural equation models and indicates the assumed direction of causation.

Comment in

References

    1. Ahrens WH, Cox DJ, Budhwar G. Use of the arcsine and square root transformations for subjectively determined percentage data. Weed Sci. 1990;XX:452–458.
    1. Alexander GE, Crutcher MD. Functional architecture of basal ganglia circuits: neural substrates of parallel processing. Trends Neurosci. 1990;13:266–271. doi: 10.1016/0166-2236(90)90107-L. - DOI - PubMed
    1. Blakemore SJ, Wolpert D, Frith C. Why can't you tickle yourself? Neuroreport. 2000;11:R11–R16. doi: 10.1097/00001756-200008030-00002. - DOI - PubMed
    1. Borg GA. Psychophysical bases of perceived exertion. Med Sci Sports Exerc. 1982;14:377–381. - PubMed
    1. Brainard DH. The Psychophysics Toolbox. Spat Vis. 1997;10:433–436. doi: 10.1163/156856897X00357. - DOI - PubMed

Publication types

LinkOut - more resources