. 2015 Jun 10;35(23):8866-81.
doi: 10.1523/JNEUROSCI.3470-14.2015.

Disruption of Fgf13 causes synaptic excitatory-inhibitory imbalance and genetic epilepsy and febrile seizures plus

Affiliations

Disruption of Fgf13 causes synaptic excitatory-inhibitory imbalance and genetic epilepsy and febrile seizures plus

Ram S Puranam et al. J Neurosci. .

Abstract

We identified a family in which a translocation between chromosomes X and 14 was associated with cognitive impairment and a complex genetic disorder termed "Genetic Epilepsy and Febrile Seizures Plus" (GEFS(+)). We demonstrate that the breakpoint on the X chromosome disrupted a gene that encodes an auxiliary protein of voltage-gated Na(+) channels, fibroblast growth factor 13 (Fgf13). Female mice in which one Fgf13 allele was deleted exhibited hyperthermia-induced seizures and epilepsy. Anatomic studies revealed expression of Fgf13 mRNA in both excitatory and inhibitory neurons of hippocampus. Electrophysiological recordings revealed decreased inhibitory and increased excitatory synaptic inputs in hippocampal neurons of Fgf13 mutants. We speculate that reduced expression of Fgf13 impairs excitability of inhibitory interneurons, resulting in enhanced excitability within local circuits of hippocampus and the clinical phenotype of epilepsy. These findings reveal a novel cause of this syndrome and underscore the powerful role of FGF13 in control of neuronal excitability.

Keywords: Fgf13; GEFS+; animal model; epilepsy; excitatory inhibitory imbalance; translocation.


Figures

Figure 1.
Figure 1.
A maternally transmitted apparently balanced translocation between the X chromosome and chromosome 14 is associated with febrile seizures, cognitive impairment necessitating special education, and temporal lobe epilepsy. A, A four generation pedigree exhibiting balanced translocation. Red symbols represent the presence of febrile seizures. Green symbols represent the presence of cognitive impairment necessitating special education classes. Black symbols represent the presence of temporal lobe epilepsy. B, GTW-banded partial karyotypes from the mother (301) and the proband (401) reveal the apparently balanced reciprocal translocation between chromosomes 14 and X [t(X; 14) (q27; q21)]. Chromosomes are arranged left to right showing the normal X chromosome (mother only), derivative X, normal chromosome 14, and derivative 14. C, EEG pattern of seizure of proband detected during video EEG monitoring. Behavioral and EEG features during segments (S1–S5) before, during, and following the seizure. S1, Segment 1: Patient is awake with eyes open and listening to nurse 5 s before seizure onset. EEG is characterized by symmetric low-voltage mixed frequencies. High-amplitude slow waves in electrodes FP1 and FP2 reflect eye movements, and low-voltage fast activity in electrodes T3 and T4 reflects muscle activity. S2, Segment 2: Patient was talking to nurse and suddenly turned and pushed button (arrow) notifying onset of seizure at which time EEG is dominated by eye movement, muscle, and movement artifacts. S3, Segment 3: Fifteen seconds following seizure onset, patient is shifting restlessly, flailing right arm purposely, and is unresponsive to nurse's questions. EEG exhibits rhythmic θ activity of higher amplitude over the left hemisphere. S4, Segment 4: Eighty-two seconds following seizure onset, patient blinks and relaxes. Rhythmic θ has terminated, and EEG now exhibits eye movement artifact, muscle artifact, and low-voltage activity with slowing more prominent in left compared with right parasagittal region. Patient was oriented to person, place, and time ∼4 min after seizure onset and did not recall any events transpiring during the seizure. S5, Segment 5: Interictal EEG recorded ∼7 h following the seizure denoted in S1-S4. Arrow indicates the occurrence of a high-amplitude sharp transient in the left temporal region. D, Fluid attenuated inversion recovery image of the proband reveals mild diffuse atrophy (arrowhead) but no evidence of hippocampal sclerosis (arrow). Scale bar, 50 mm. L, Left; R, right.
Figure 2.
Figure 2.
Mapping the translocation breakpoints on X-chromosome and chromosome 14. A, Dual-color FISH analysis using X-chromosome-specific BACs. BAC-XH (RP1-106C24 labeled with Spectrum Green-dUTP) and BAC-XF (RP1-260J9 labeled with Spectrum Orange-dUTP) probes were hybridized to metaphase spreads of the proband's mother exhibiting the translocation. Green and orange signals are present on the normal X chromosome and the derivative X chromosome [der(X)]. In addition, the green signal is also present on the derivative chromosome 14 [der (14)], demonstrating that the BAC-XH (RP1-106C24) spans the breakpoint of translocation (inset). B, Dual-color FISH analysis using chromosome 14-specific BACs. BAC-14C (RP11-245O17, labeled with Spectrum Green-dUTP) and BAC-14J (RP11-321F3 labeled with Spectrum Orange-dUTP) probes were hybridized to metaphase spreads of the proband's mother exhibiting the translocation. The green signal is present on the normal 14, the derivative 14 [der (14)], and the derivative X chromosome [der(X)]. The orange signal is present on the normal chromosome 14 and derivative X, demonstrating that BAC-14C (RP11-245O17) spans the breakpoint of translocation (inset). C, The relative positions of the BACs (BACs X-A to X-K, vertical lines) are shown on Xq25-q27.1 (top line); the region harboring the breakpoint. BAC-H (RP1-106C24 shown as red line) was found to span the breakpoint (Fig. 1B). To pinpoint the location of the breakpoint within BAC-H, dual-color FISH experiments were performed using fosmids 1–5, narrowing the region of the breakpoint to ∼17 kb and demonstrating that fosmid F4 (red line) spanned the breakpoint. PCR primers (X1-X20 and X1–2 to X19–20) were designed as shown in the figure and used to amplify the control genomic DNA (father; Fig. 1A) and the translocation harboring genomic DNA (proband's genomic DNA Fig. 1A). D, The presence of the amplicons using primers X13–14 and X14–15 in the translocation harboring genomic DNA of the proband (P) together with the absence of amplicon using primers X14 (depicted by arrow) narrowed the region of the breakpoint to ∼400 bp. Using the control genomic DNA of the father (F), PCR amplicons with all the primers were generated. E, The relative positions of BACs 14A-14F used as probes for dual-color FISH experiments are presented as horizontal lines. These experiments revealed three distinct BACs spanning the breakpoint, BACs 14C, 14D, and 14E. Information on the coordinates of these three BACs narrowed the breakpoint to a region approximating 20 kb as depicted by the vertical lines in the expanded segment of chromosome 14 in the lower part of figure. PCR primers using chromosome 14 sequences (14-F1 to 14-F40) in the forward direction and PCR primers either X-14R or X15-R in the reverse direction were designed to identify an amplicon harboring the translocation breakpoint using the proband's genomic DNA as the template. F, The chromosome 14 breakpoint is located between the primers 14-F40 and X-14R. Using primers designed as depicted in A, primer pair combination 14-39F-X-14R (lane 1), 14-40F- X-14R (lane 2), 14-39F- X-15R (lane 3), and 14-40F -X15R (lane 4), amplicons were generated using genomic DNA of proband (401; Fig. 1A) as the template. PCR using genomic DNA of the father (310; Fig. 1A) as the template did not generate the amplicons seen with the proband's DNA.
Figure 3.
Figure 3.
Translocation disrupts a gene on the X chromosome that encodes a member of the fibroblast growth factor family, Fgf13. A, PCR amplification X-14 and 14-X translocation junctions in all affected individuals. X-14 junction: Using primers X-BP F (X-chromosome-specific) and X-BP R (chromosome 14-specific), a ∼350 bp junction amplicon was generated from affected individuals harboring the translocation (lanes 1, 3, and 4, individuals 301, 401, and 402; Fig. 1A) but not from the unaffected individuals (lanes 2 and 5, individuals 310 and 302; Fig. 1A) using genomic DNA as template. 14-X junction: Using primers, 14-BP F (chromosome 14-specific) and 14-BP R (X-chromosome-specific), a ∼700 bp junction amplicon was generated from affected individuals harboring the translocation (lanes 1, 3, and 4, individuals 301, 401, and 402; Fig. 1A) but not from the unaffected individuals (lanes 2 and 5, individuals 310 and 302; Fig. 1A) using genomic DNA as template. B, Identification of the precise positions of the breakpoints on the derivative X and 14 chromosomes: Sequencing and BLAST analysis of the 350 and 700 bp junction amplicons generated from the genomic DNA of 301 revealed the breakpoint on X chromosome at position 137727985 and at position 43651276 on chromosome 14. The junction sequences of 401 and 402 were identical to the sequence from 301. All coordinates are from the human genome browser at http://www.genome.ucsc.edu/ (NCBI36/hg18 assembly). The breakpoint on X-chromosome disrupts the negative strand-encoded gene Fgf13. C, Physical map of the X-chromosome and chromosome 14 in the region of the translocation breakpoints. Locations of the breakpoint on chromosomes X (top). Location of the FGF13-isoforms and the breakpoint on the negative strand of X chromosome are shown. The positions of the exon 1's (i.e., 1V, 1Y, 1U, 1S) and exons 2–5 were constructed using the published mRNA and protein sequence and the human genome browser at http://www.genome.ucsc.edu/. The location of the breakpoint between exons 1U and 1Y was determined by DNA sequencing and located at position 137727985 on the X chromosome. Location of the breakpoint on the chromosome 14 (bottom). The annotated genes closest to the breakpoint at position 43651376 bp are KLHL5, a BTB (POZ) domain-containing 5 protein, and LRNF5 (leucine rich repeat and fibronectin Type III). The annotated genes were identified from the UCSC browser using multiple gene prediction programs, including RefSeq, Uniport, GenBank, Comparative Genomics, Consensus CDS, and others. In contrast to these annotated genes, some hypothetical genes closer to the breakpoint were predicted by the above listed programs, but whether these putative genes are expressed remains to be established. D, Detection of Fgf13 isoforms by RT-PCR using total RNA isolated from the lymphoblastoid cell lines established from the unaffected individual 310 and affected individual 401. Amplicons reflecting isoforms 1S and 1U were generated by RT-PCR from the lymphoblastoid cell line total RNA of both individuals, whereas amplicons reflecting isoforms 1V, 1VY, and 1VY + 1Y were generated only from the unaffected individual 310. The absence of 1V, 1VY, and 1VY + 1 Y isoforms in the affected individual confirms the position of the breakpoint on X chromosome. The amplicons were sequenced and their identity confirmed by BLAST analysis.
Figure 4.
Figure 4.
Targeted ablation of Fgf13 gene leads to embryonic lethality in mutant male mice and reduction in the expression of the mRNA and protein in the mutant female mice. A, The strategy for the generation of the Fgf13 knock-out mice. The gene structure of mouse Fgf13 gene along with the targeting locus and targeting vector is shown schematically. Fgf13 mutant mice were generated by homologous recombination. Targeting vector was designed to remove the 3′ region of the exon 2 and a 600 bp intronic sequence common to all isoforms and replace it with a neo-cassette and an in-frame stop codon after the last codon of the remaining exon 2. B, Southern blot confirmation of the modification of the fgf13 locus in the mutant female mice using MSc1 and Mfe1 restriction enzyme digests of the genomic DNA. Horizontal line in the targeting locus schematic indicates the position of the 1.35 kb probe used for the southern hybridization. C, PCR validation of the wild-type, heterozygous, and homozygous genotypes of the E12.5 embryos and the determination of the sex of the embryos. Lane 1 represents an Fgf13 mutant male from nonviable embryo (homozygous); lanes 2 and 5, wild-type males; lanes 3 and 4, Fgf13 mutant females (heterozygous); lanes 6 and 7, wild-type females. D, Quantitation of pan Fgf13 mRNA by qPCR of hippocampal and cortical total RNA from mutant female mice (n = 10) and wild-type, litter- and age-matched female mice (n = 10). Data are mean ± SD. p < 0.001 (unpaired t test). Hippocampal RNA, *p = 1.6e-8 (t = 9.64, df = 18. Cortical RNA, **p = 4.0e-9 (t = 10.53, df = 18). E, Relative levels FGF13 protein in the cortical lysates of the mutant female mice (n = 8) compared with the wild-type female control mice (n = 7). Data are mean ± SD. p < 0.005. *p = 0.0048 (unpaired t test, t = 4.06, df = 7). Inset, Representative Western blot of sample from wild-type and mutant mouse.
Figure 5.
Figure 5.
Age-dependent susceptibility to hyperthermia-induced seizures in Fgf13+/− mice. A, Schematic representation of the hyperthermia-induced seizure protocol. Black arrows indicate the time at which the mouse enters the hyperthermia chamber and the time at which the heat source is turned off. Shaded arrowhead on top of the line indicates the time at which the 10 min acclimatization to the chamber is over and the heat source was turned on. Arrowheads indicate the time at which a new temperature in increments of 0.5°C was set starting from 37.5°C. Triangles represent the point at which the temperature set-point was achieved. Bars on top of the line represent the duration of 2 min the animals were held at a particular temperature. B, Percentage of Fgf13+/− mice and wild-type mice at P15, P30, and P60 remaining seizure free plotted against core body temperature. Filled diamonds represent P15 mutant animals. Filled square line represents wild-type animals. P30 and P60 animals did not exhibit any seizures at any given temperature and were identical to the wild-type animals. Log-rank test revealed a significant difference between the P15 wild-type (n = 8) and mutant (n = 11) animal seizure-free rates (p = 0.0006; χ2 = 11.73, df = 1). All experiments were performed in a blinded manner to the genotype of the animals. C, Percentage of P15 Fgf13+/− exhibiting seizures. Percentage of wild-type animals and Fgf13+/− mutant animals exhibiting seizures at different ages (P15, P30, and P60) is shown. Wild-type: P15, n = 8; P30, n = 6; P60, n = 4; mutant: P15, n = 11; P30, n = 5; P60, n = 5.
Figure 6.
Figure 6.
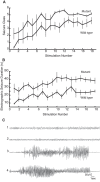
Fgf-13+/− mice exhibit enhanced rate of kindling development and spontaneous recurrent seizures. A, Kindling development is presented as behavioral seizure class (y-axis). Stimulation number (x-axis) refers to the number of stimulations that evoked an electrographic seizure with duration of at least 5 s. Bottom line, Wild-type animals (n = 8). Top line, Fgf13+/− mutant (n = 13) animals. Data are mean ± SEM. Area under the curve analysis for seizure class demonstrated a significant difference (p = 0.002) between wild-type and mutant animals (area under ROC curve = 0.804; SEM = 0.074; df = 17). B, Electrographic seizure duration (seconds) as a function of stimulation number in Fgf13+/− (n = 13) and wild-type mice (n = 8). Bottom line, Wild-type animals. Top line, Fgf13+/− mutant animals. Data are mean ± SEM. Area under the curve analysis for seizure duration demonstrated a significant difference (p = 5.6e-22) between wild-type and mutant animals (area under ROC curve = 0.985; SEM = 0.015; df = 17). C, Spontaneous recurrent seizures in Fgf13 mutant mice. Representative EEG recordings from hippocampus of two wild-type (n = 5) and two mutant animals (n = 5) are shown in C1-C2 and C3-C4, respectively. C1 and C2 are representative EEG recordings from hippocampus of wild-type littermate control female mice. C3 and C4 are representative EEG recordings from hippocampus of littermate mutant mice. All five mutant mice exhibited seizures providing statistically significant evidence (χ2, p = 0.0015) for spontaneous recurrent seizures in the Fgf13 heterozygous mice Mutant animal represented in C3 exhibited 30 spontaneous recurrent seizures (SR) and the animal represented in C4 exhibited 6 spontaneous recurrent seizures. Detection of seizures was performed by individual blinded manner to the genotype of the animals.
Figure 7.
Figure 7.
Fgf13 is expressed in excitatory and inhibitory neurons in mouse hippocampus. A–C, ISH of an adult mouse coronal section using branched nucleotide probes for Fgf13. DAPI staining of the coronal section on which the Fgf13 ISH was performed is shown in A. Fgf13 ISH with branched nucleotide probes shows high expression of the mRNA in multiple regions of the brain, particularly in hippocampus, and pyriform cortex with moderate expression in neocortex and thalamus (B). An enlarged image revealed scattered cells in hippocampus strata oriens (blue arrowheads), radiatum (yellow arrowheads), and lacunosum moleculare (green arrowheads) consistent with expression within interneurons of the CA1 region (C). Scale bars: A, B, 1000 μm. D–F, Dual-color ISH using Gad-1(green) and Fgf13 (red) probes demonstrating the expression of Fgf13 in both excitatory neurons and inhibitory neurons as seen in the merged image by the colocalization of the signals in the CA1 region of the mouse hippocampus. Yellow and red arrows indicate the colocalization of Fgf13 and Gad-1 in interneurons in stratum oriens and stratum radiatum, respectively. Scale bar, 100 μm.
Figure 8.
Figure 8.
Synaptic properties of CA1 pyramidal neurons in wild-type and Fgf13 mutants. A, Representative whole-cell recordings of sIPSCs and mIPSCs from hippocampal CA1 pyramidal neurons in wild-type and Fgf13+/− mutant animals. B, C, Cumulative fraction curves of interevent intervals (left), average frequency (middle), and amplitude (right) of sIPSCs (B) and mIPSCs (C) in wild-type and Fgf13+/− mutant cells. Data are mean ± SEM. *p < 0.05. **p < 0.01. For sIPSC recordings, n = 14 cells from n = 14 slices for wild-type, and n = 12 cells from n = 12 slices for mutant. sIPSC frequency difference: p = 0.02 (t = 2.15, df = 24); sIPSC amplitude difference: p = 0.07 (t = 1.50, df = 24). For mIPSC recordings, n = 19 cells from n = 19 slices for wild-type, and n = 18 cells from n = 18 slices for mutant. mIPSC frequency difference: p = 0.35 (t = 0.40, df = 35); mIPSC amplitude difference: p = 0.002 (t = 3.18, df = 35). D, Representative sEPSCs and mEPSCs from wild-type and Fgf13+/− mutant hippocampal CA1 pyramidal neurons. E, F, Cumulative fraction curves of interevent intervals (left), average frequency (middle), and amplitude (right) of sEPSCs (E) and mEPSCs (F) in wild-type and Fgf13+/− mutant cells. p < 0.05 (unpaired t test). All experiments were performed in a blinded manner to the genotype of the animals. Data are mean ± SEM. *p < 0.05. For sEPSC recordings, n = 11 cells from n = 11 slices for wild-type, and n = 14 cells from n = 14 slices for mutant. sEPSC frequency difference: p = 0.04 (t = 1.87, df = 16.6, t test with Welch's correction due to significant F test for variance comparison [F = 8.82, p = 0.002]); sEPSC amplitude difference: p = 0.48 (t = 0.06, df = 23). For mEPSC recordings, n = 13 cells from n = 13 slices for wild-type and n = 15 cells from n = 15 slices for mutant. mEPSC frequency difference: p = 0.38 (t = 0.30, df = 26); mEPSC amplitude difference: p = 0.33 (t = 0.46, df = 26).
Figure 8.
Figure 8.
Synaptic properties of CA1 pyramidal neurons in wild-type and Fgf13 mutants. A, Representative whole-cell recordings of sIPSCs and mIPSCs from hippocampal CA1 pyramidal neurons in wild-type and Fgf13+/− mutant animals. B, C, Cumulative fraction curves of interevent intervals (left), average frequency (middle), and amplitude (right) of sIPSCs (B) and mIPSCs (C) in wild-type and Fgf13+/− mutant cells. Data are mean ± SEM. *p < 0.05. **p < 0.01. For sIPSC recordings, n = 14 cells from n = 14 slices for wild-type, and n = 12 cells from n = 12 slices for mutant. sIPSC frequency difference: p = 0.02 (t = 2.15, df = 24); sIPSC amplitude difference: p = 0.07 (t = 1.50, df = 24). For mIPSC recordings, n = 19 cells from n = 19 slices for wild-type, and n = 18 cells from n = 18 slices for mutant. mIPSC frequency difference: p = 0.35 (t = 0.40, df = 35); mIPSC amplitude difference: p = 0.002 (t = 3.18, df = 35). D, Representative sEPSCs and mEPSCs from wild-type and Fgf13+/− mutant hippocampal CA1 pyramidal neurons. E, F, Cumulative fraction curves of interevent intervals (left), average frequency (middle), and amplitude (right) of sEPSCs (E) and mEPSCs (F) in wild-type and Fgf13+/− mutant cells. p < 0.05 (unpaired t test). All experiments were performed in a blinded manner to the genotype of the animals. Data are mean ± SEM. *p < 0.05. For sEPSC recordings, n = 11 cells from n = 11 slices for wild-type, and n = 14 cells from n = 14 slices for mutant. sEPSC frequency difference: p = 0.04 (t = 1.87, df = 16.6, t test with Welch's correction due to significant F test for variance comparison [F = 8.82, p = 0.002]); sEPSC amplitude difference: p = 0.48 (t = 0.06, df = 23). For mEPSC recordings, n = 13 cells from n = 13 slices for wild-type and n = 15 cells from n = 15 slices for mutant. mEPSC frequency difference: p = 0.38 (t = 0.30, df = 26); mEPSC amplitude difference: p = 0.33 (t = 0.46, df = 26).

References

    1. Banerjee P, Hauser W. Incidence prevalence. In: Engel J, Pedley T, editors. Epilepsy: a comprehensive textbook. Ed 2. Philadelphia: Wolters Kluwer Lippincott Williams & Wilkins; 2008. pp. 45–56.
    1. Baulac S, Huberfeld G, Gourfinkel-An I, Mitropoulou G, Beranger A, Prud'homme JF, Baulac M, Brice A, Bruzzone R, LeGuern E. First genetic evidence of GABA(A) receptor dysfunction in epilepsy: a mutation in the gamma2-subunit gene. Nat Genet. 2001;28:46–48. doi: 10.1038/ng0501-46. - DOI - PubMed
    1. Borges K, Gearing M, McDermott DL, Smith AB, Almonte AG, Wainer BH, Dingledine R. Neuronal glial pathological changes during epileptogenesis in the mouse pilocarpine model. Exp Neurol. 2003;182:21–34. doi: 10.1016/S0014-4886(03)00086-4. - DOI - PubMed
    1. Catterall WA. Sodium channels inherited epilepsy antiepileptic drugs. Annu Rev Pharmacol Toxicol. 2014;54:317–338. doi: 10.1146/annurev-pharmtox-011112-140232. - DOI - PubMed
    1. Cheah CS, Yu FH, Westenbroek RE, Kalume FK, Oakley JC, Potter GB, Rubenstein JL, Catterall WA. Specific deletion of NaV1.1 sodium channels in inhibitory interneurons causes seizures premature death in a mouse model of Dravet syndrome. Proc Natl Acad Sci U S A. 2012;109:14646–14651. doi: 10.1073/pnas.1211591109. - DOI - PMC - PubMed

Publication types

MeSH terms

Substances