. 2015 May 6;2(5):150081.
doi: 10.1098/rsos.150081. eCollection 2015 May.

The evolution of popular music: USA 1960-2010

Affiliations

The evolution of popular music: USA 1960-2010

Matthias Mauch et al. R Soc Open Sci. .

Abstract

In modern societies, cultural change seems ceaseless. The flux of fashion is especially obvious for popular music. While much has been written about the origin and evolution of pop, most claims about its history are anecdotal rather than scientific in nature. To rectify this, we investigate the US Billboard Hot 100 between 1960 and 2010. Using music information retrieval and text-mining tools, we analyse the musical properties of approximately 17 000 recordings that appeared in the charts and demonstrate quantitative trends in their harmonic and timbral properties. We then use these properties to produce an audio-based classification of musical styles and study the evolution of musical diversity and disparity, testing, and rejecting, several classical theories of cultural change. Finally, we investigate whether pop musical evolution has been gradual or punctuated. We show that, although pop music has evolved continuously, it did so with particular rapidity during three stylistic 'revolutions' around 1964, 1983 and 1991. We conclude by discussing how our study points the way to a quantitative science of cultural change.

Keywords: cultural evolution; diversity; popular music; stylistic revolutions.


Figures

Figure 1.
Figure 1.
Data processing pipeline illustrated with a segment of Queen's Bohemian Rhapsody, 1975, one of the few Hot 100 hits to feature an astrophysicist on lead guitar.
Figure 2.
Figure 2.
Evolution of musical topics in the Billboard Hot 100. Mean topic frequencies (q¯) ±95% CI estimated by bootstrapping.
Figure 3.
Figure 3.
Evolution of musical styles in the Billboard Hot 100. The evolution of 13 styles, defined by k-means clustering on principal components of topic frequencies. The width of each spindle is proportional to the frequency of that style, normalized to each year. The spindle contours are based on a ±2-year moving average smoother; unsmoothed yearly frequencies are shown as grey horizontal lines. A hierarchical cluster analysis on the k-means centroids grouped our styles into several larger clusters here represented by a tree: an EASY-LISTENING + LOVE-SONG cluster, a COUNTRY + ROCK cluster and SOUL + FUNK + DANCE cluster; the fourth, most divergent, cluster only contains the HIP HOP + RAP-rich style 2. All resolved nodes have ≥75% bootstrap support. Labels list the four most highly over-represented Last.fm user tags in each style according to our enrichment analysis; see electronic supplementary material, table S1 for full results. Shaded regions define eras separated by musical revolutions (figure 5).
Figure 4.
Figure 4.
Evolution of musical diversity in the Billboard Hot 100. We estimate four measures of diversity. From left to right: song number in the charts, DN, depends only on the rate of turnover of unique entities (songs), and takes no account of their phenotypic similarity. Class diversity, DS, is the effective number of styles and captures functional diversity. Topic diversity, DT, is the effective number of musical topics used each year, averaged across the harmonic and timbral topics. Disparity, DY, or phenotypic range is estimated as the total standard deviation within a year. Note that although in ecology DS and DY are often applied to sets of distinct species or lineages they need not be; our use of them implies nothing about the ontological status of our styles and topics. For full definitions of the diversity measures, see electronic supplementary material, M11. Shaded regions define eras separated by musical revolutions (figure 5).
Figure 5.
Figure 5.
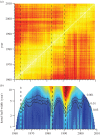
Musical revolutions in the Billboard Hot 100. (a) Quarterly pairwise distance matrix of all the songs in the Hot 100. (b) Rate of stylistic change based on Foote Novelty over successive quarters for all windows 1–10 years, inclusive. The rate of musical change—slow-to-fast—is represented by the colour gradient blue, green, yellow, red, brown: 1964, 1983 and 1991 are periods of particularly rapid musical change. Using a Foote Novelty kernel with a half-width of 3 years results in significant change in these periods, with Novelty peaks in 1963–Q4 (p<0.01), 1982–Q4 (p<0.01) and 1991–Q1 (p<0.001) marked by dashed lines. Significance cut-offs for all windows were empirically determined by random permutation of the distance matrix. Significance contour lines with p-values are shown in black.
Figure 6.
Figure 6.
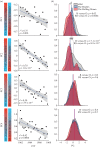
The British Invasion in the American revolution of 1964. Top to bottom: PC1–PC4. (a) Linear evolution of quarterly medians of four PCs in the 6 years (24 quarters) flanking 1963–Q4, the peak of the 1964 revolution. The population medians of all four PCs decrease, and these decreases begin well before the start of the British Invasion (BI) in late 1963, implying that BI acts cannot be solely responsible for the changes in musical style evident at the time. For each PC, the two topics that load most strongly are indicated, with sign of correlation—high, red to low, blue—indicated (electronic supplementary material, figure S2). (b) Frequency density distributions of four PCs for the Beatles, The Rolling Stones and songs by all other artists around the 1964 revolution. For PC1 and PC2, but not PC3 and PC4, The Beatles and The Rolling Stones have significantly lower median values than the rest of the population, indicated by arrows, implying that these BI artists adopted a musical style that exaggerated existing trends in the Hot 100 towards increased use of major chords and decreased use of ‘bright’ speech (PC1) and increased guitar-driven aggression and decreased use of mellow vocals (PC2). Vertical lines represent medians; p-values based on Mann–Whitney–Wilcoxon rank sum test; The Beatles (B): n=46; The Rolling Stones (RS): n=20; other artists (O): n=3114.

References

    1. Adorno TW. 1941. On popular music. Stud. Philos. Soc. Sci. 9, 17–48.
    1. Adorno TW. 1975. Culture industry reconsidered. New German Critique 6, 12–19. (doi:10.2307/487650) - DOI
    1. Frith S. 1988. Music for pleasure. Cambridge, UK: Polity Press.
    1. Mauch M. 2011. The anatomy of the UK charts: a light-hearted investigation of 50 years of UK charts using audio data; collection of 5 blog posts. See http://schall-und-mauch.de/anatomy-of-the-charts/.
    1. Negus K. 1996. Popular music theory. Cambridge, UK: Polity.

LinkOut - more resources