. 2016 Jan;10(1):145-57.
doi: 10.1038/ismej.2015.90. Epub 2015 Jun 12.

Neonatal environment exerts a sustained influence on the development of the intestinal microbiota and metabolic phenotype

Affiliations

Neonatal environment exerts a sustained influence on the development of the intestinal microbiota and metabolic phenotype

Claire A Merrifield et al. ISME J. 2016 Jan.

Abstract

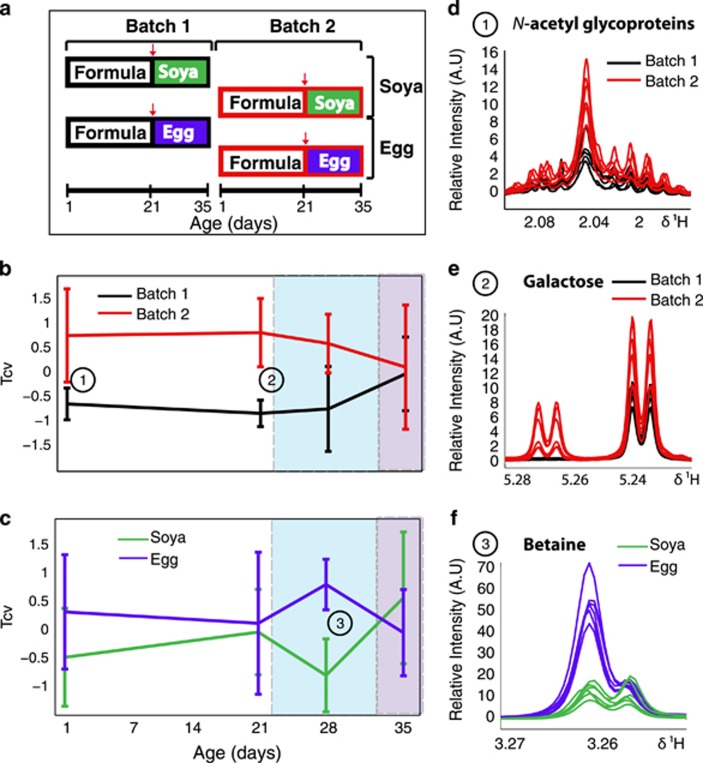
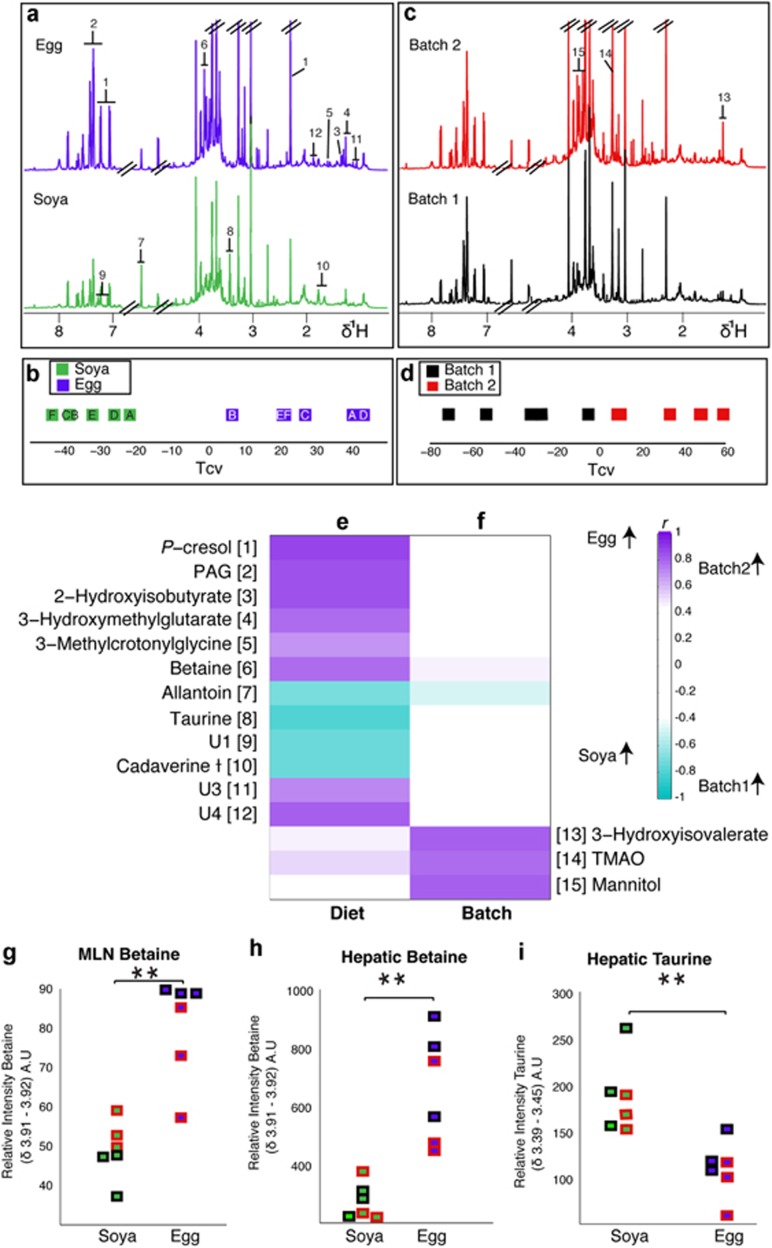
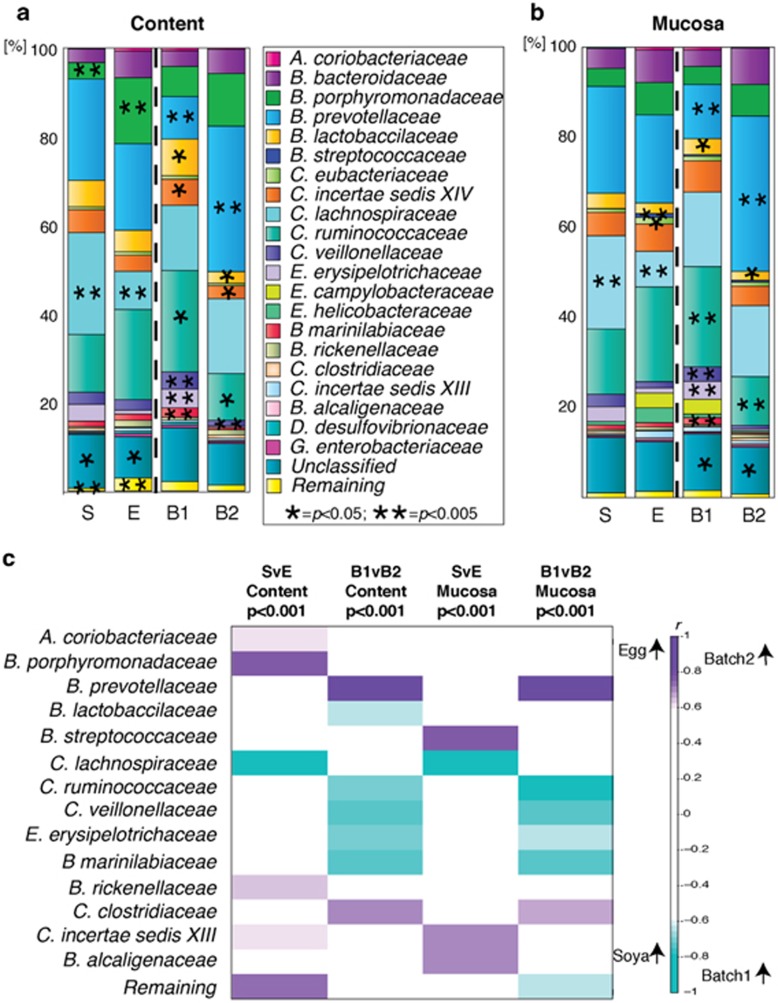
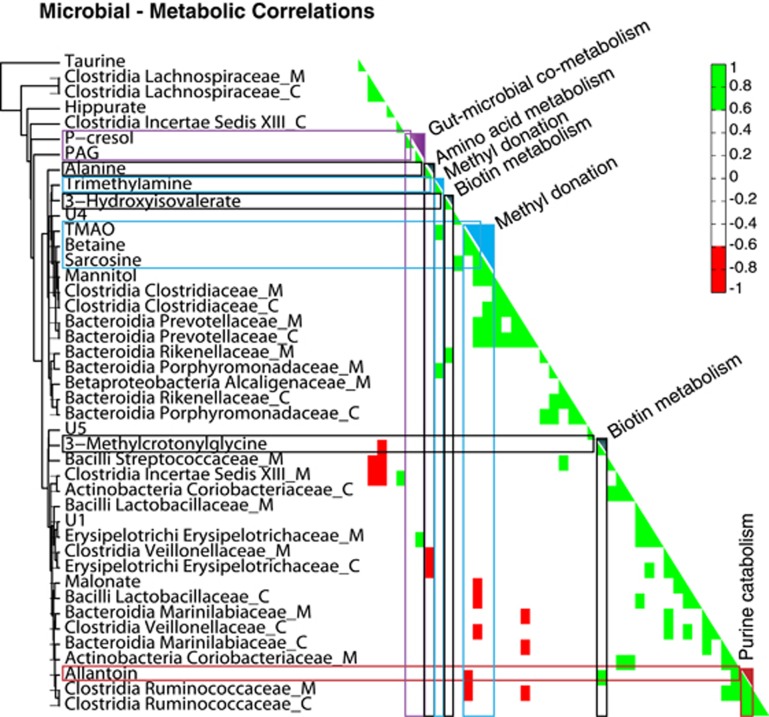
The postnatal environment, including factors such as weaning and acquisition of the gut microbiota, has been causally linked to the development of later immunological diseases such as allergy and autoimmunity, and has also been associated with a predisposition to metabolic disorders. We show that the very early-life environment influences the development of both the gut microbiota and host metabolic phenotype in a porcine model of human infants. Farm piglets were nursed by their mothers for 1 day, before removal to highly controlled, individual isolators where they received formula milk until weaning at 21 days. The experiment was repeated, to create two batches, which differed only in minor environmental fluctuations during the first day. At day 1 after birth, metabolic profiling of serum by (1)H nuclear magnetic resonance spectroscopy demonstrated significant, systemic, inter-batch variation which persisted until weaning. However, the urinary metabolic profiles demonstrated that significant inter-batch effects on 3-hydroxyisovalerate, trimethylamine-N-oxide and mannitol persisted beyond weaning to at least 35 days. Batch effects were linked to significant differences in the composition of colonic microbiota at 35 days, determined by 16 S pyrosequencing. Different weaning diets modulated both the microbiota and metabolic phenotype independently of the persistent batch effects. We demonstrate that the environment during the first day of life influences development of the microbiota and metabolic phenotype and thus should be taken into account when interrogating experimental outcomes. In addition, we suggest that intervention at this early time could provide 'metabolic rescue' for at-risk infants who have undergone aberrant patterns of initial intestinal colonisation.


Figures

Figure 1
Figure 1
The temporal effects of early-life environment and weaning diet on the metabolic profile of porcine blood serum. (a) Represents the experimental setup, where batch 1 and 2 correspond to the experimental replicate. Animals were fed formula at 1 day until 21 days, at which point they were weaned onto either an egg- or soya-based diet (weaning is denoted by red arrow). At each time-point, a pairwise comparison was made by O-PLS-DA (mean-centred scaling), between either the two experimental batches; (b) (n=6 per group) or the two weaning diets; (c) (n=6 per group) and the mean of the cross-validated scores (Tcv) from each model (± s.d.) are plotted at 1, 21, 28 and 35 days. The spectral regions derived from 600MHz Carr-Purcell-Meiboom-Gill (CPMG) metabolic profiles of serum of selected discriminatory metabolites at each time-point have been plotted; (d) shows increased serum N-acetyl glycoproteins in batch 2 at 1 day; (e) shows increased galactose in batch 2 at 21 days and (f) depicts increased in betaine in the egg-fed animals at 28 days.
Figure 2
Figure 2
Weaning diet and early environment both affect the urinary metabolic phenotype of the young pig. Median spectra from each group fed either an egg-based (top, n=6) or soya-based (bottom, n=6) diet (a) with numbers corresponding to the listed metabolites (e) and (f). The groups underwent comparison by pairwise O-PLS-DA analysis conducted with one predictive and one orthogonal component (Q2Y: 0.81, R2Y: 0.97, R2X: 0.54) and the cross-validated scores (Tcv) are shown (b), each point represents one animal and the letters correspond to litter. Discriminating metabolites are shown in (e). (c) Represents median spectra from each experimental batch with numbers corresponding to the listed metabolites in (e) and (f). The Tcv from an O-PLS-DA model constructed with one predictive and one orthogonal component (Q2Y: 0.72, R2Y: 0.92, R2X: 0.50) are shown in (d). The discriminatory metabolites from this model are highlighted in (f). Plots of integral regions calculated from 600 MHz HR-MAS-NMR spectra of tissues from each animal; (g) relative betaine concentration in the MLN, where the points on the left represent the animals on the soya diet and those on the right the egg diet. Animals in batch 1 are outlined in black, whereas those in batch 2 are outlined in red. Integral regions of hepatic betaine (h) and hepatic taurine (i). ** denotes P<0.001 (Wilcoxon rank sum).
Figure 3
Figure 3
Weaning diet and early environment affect the composition of microbiota in the colonic content and mucosa of the young pig. The mean relative proportion (%) of bacterial families measured by 16 S DNA sequencing (V1+V2 and V4 regions) is summarised for each intervention in the colonic content (a) and for the colonic mucosa (b). Each figure has a colour-coded representation of the relative proportion of bacteria as summarised by the key and is separated into animals on a soya-based diet (S, n=6), an egg-based diet (E, n=6), those in batch 1 (B1, n=6) and those in batch 2 (B2, n=6). The diets (soya vs egg) were statistically compared using the Wilcoxon rank sum test for each bacterial family, as were the batches (batch 1 vs batch 2). Statistical significance of P<0.05 is indicated by (*) and P<0.005 by (**). The O-PLS-DA correlation coefficients for a series of four separate O-PLS-DA models, constructed on the mean relative proportions of bacteria, denoted at the top of the column (cmk. Full bacterial family names are: Actinobacteria coriobacteriaceae; Bacteroidia bacteroidaceae; Bacteroidia porphyromonadaceae; Bacteroidia prevotellaceae; Bacilli lactobacillaceae; Bacilli streptococcaceae; Clostridia eubacteriaceae; Clostridia incertae sedis XN; Clostridia lachnospiraceae; Clostridia ruminococcaceae; Clostridia veillonellaceae; Erysipelotrichi erysipelotrichaceae; Erysipelotrichi campylobacteraceae; Epsilonproteobacteria helicobactereaceae; Bacteroidia marinilabiaceae; Bacteroidia rickenellaceae; Clostridia clostridiaceae; Clostridia incertae sedis XIII; Betaproteobacteria alcaligenaceae; Deltaproteobacteria desulfovibrionaceae; Gammaproteobacteria enterobacteriaceae.
Figure 4
Figure 4
Microbial-metabolic interactions are visible across multiple metabolic pathways. A hierarchical clustering and correlation map between bacterial families and selected metabolic integrals. Positive correlations are shown in green and negative correlations in red. Gut microbial metabolites are highlighted in purple, metabolites related to methyl donation in blue, metabolites related to biotin in grey and those related to purine metabolism in red. The suffix ‘_C' denotes bacteria isolated from the colonic content and the suffix ‘_M' denotes those isolated from the colonic.

References

    1. Aiken CE, Ozanne SE. (2014). Transgenerational developmental programming. Hum Reprod Update 20: 63–75. - PubMed
    1. al-Waiz M, Mikov M, Mitchell SC, Smith RL. (1992). The exogenous origin of trimethylamine in the mouse. Metabolism 41: 135–136. - PubMed
    1. Atkinson W, Slow S, Elmslie J, Lever M, Chambers ST, George PM. (2009). Dietary and supplementary betaine: effects on betaine and homocysteine concentrations in males. Nutr Metab Cardiovasc Dis 19: 767–773. - PubMed
    1. Bajaj JS, Hylemon PB, Younossi Z. (2012). The intestinal microbiota and liver disease. Am J Gastroenterol Suppl 1: 9–14.
    1. Barker DJP. (1999). Early growth and cardiovascular disease. Arch Dis Child 80: 305–307. - PMC - PubMed

Publication types