. 2015;15(5):4.
doi: 10.1167/15.5.4.

Mechanisms for perception of numerosity or texture-density are governed by crowding-like effects

Affiliations

Mechanisms for perception of numerosity or texture-density are governed by crowding-like effects

Giovanni Anobile et al. J Vis. 2015.

Abstract

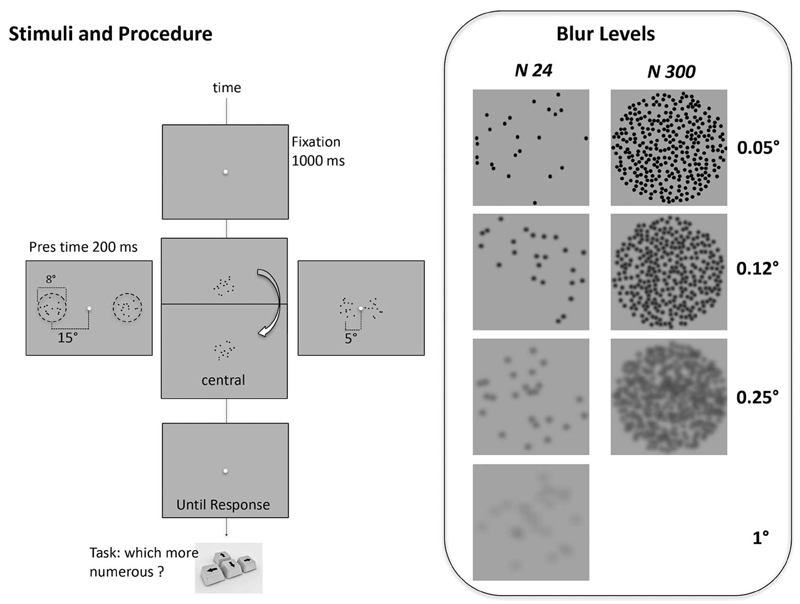
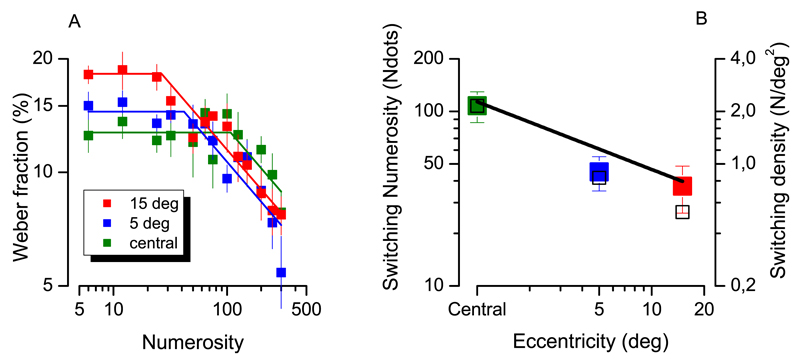
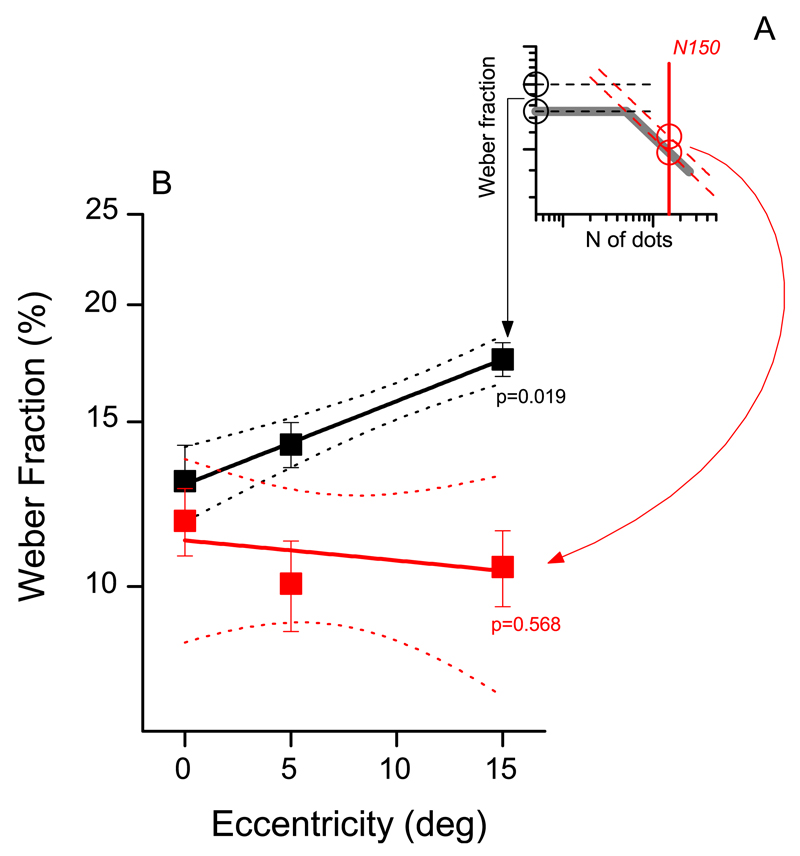
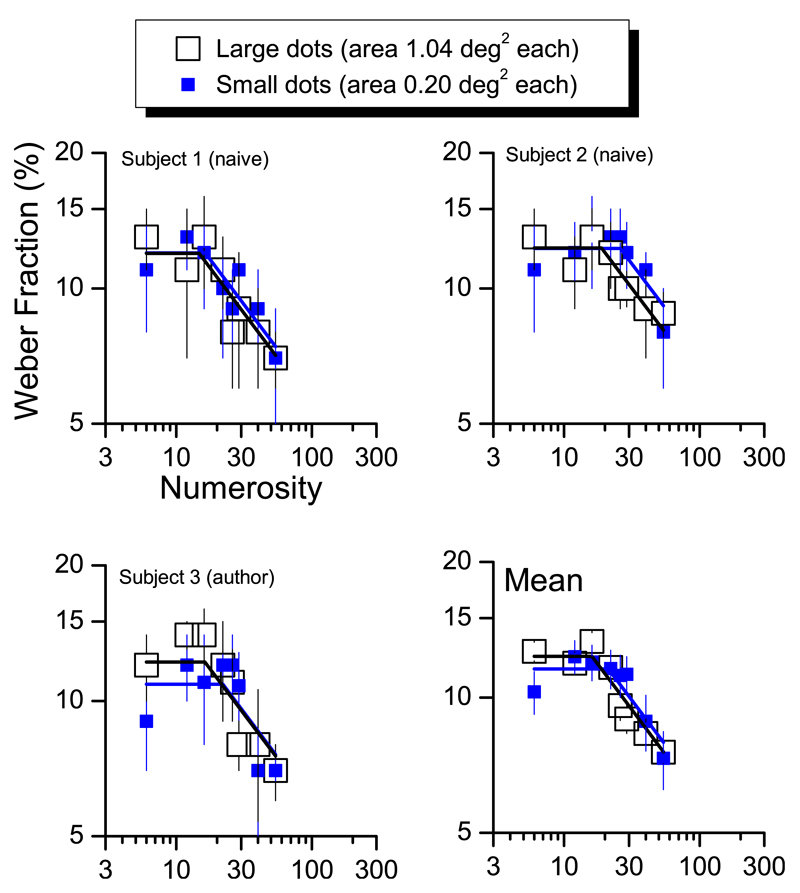
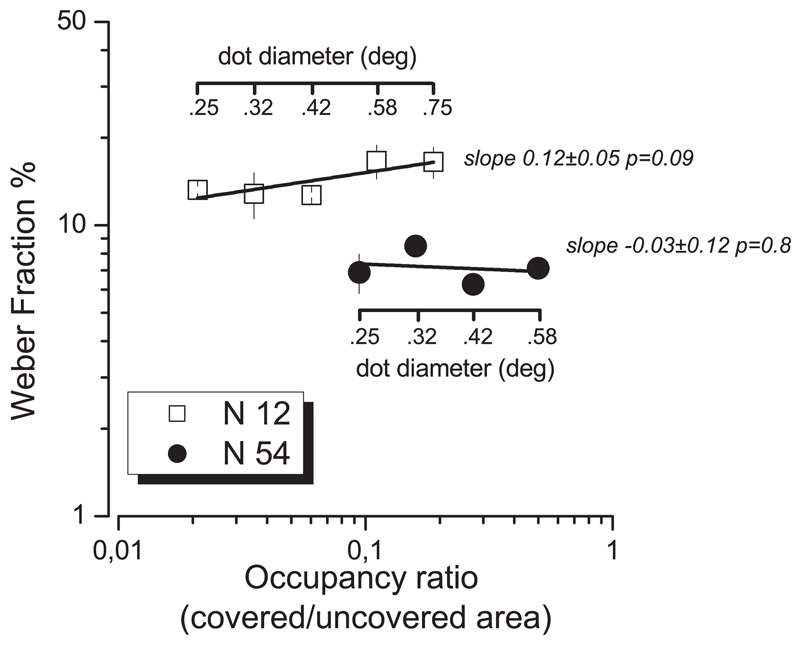
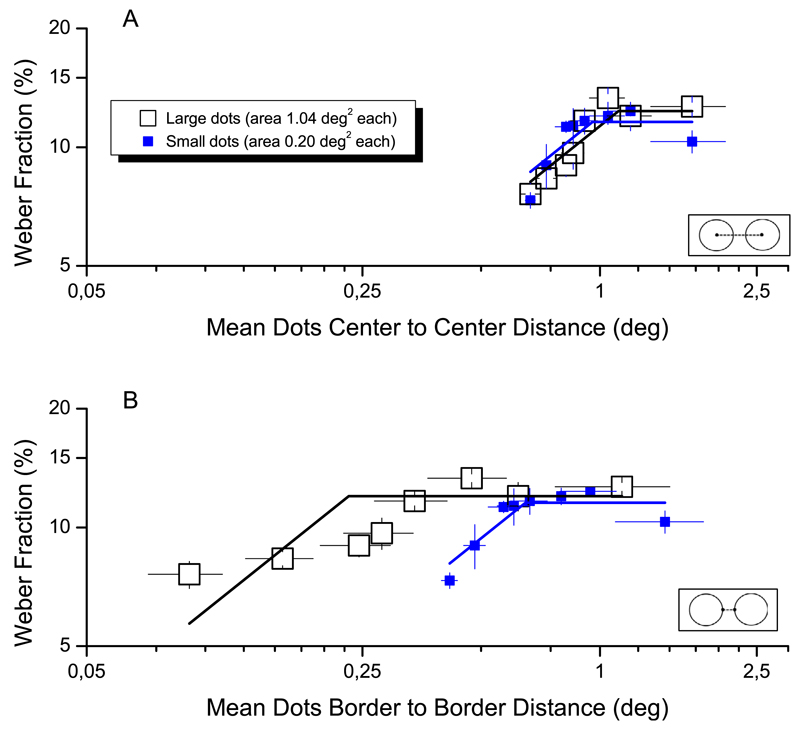
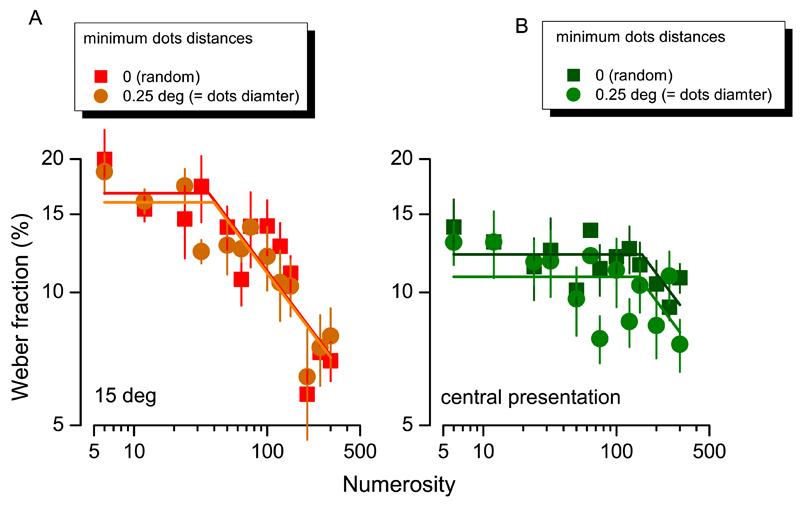
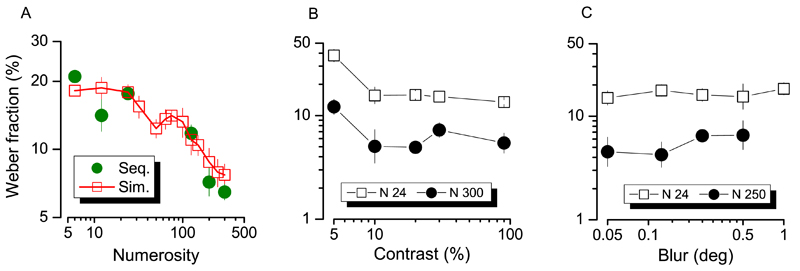
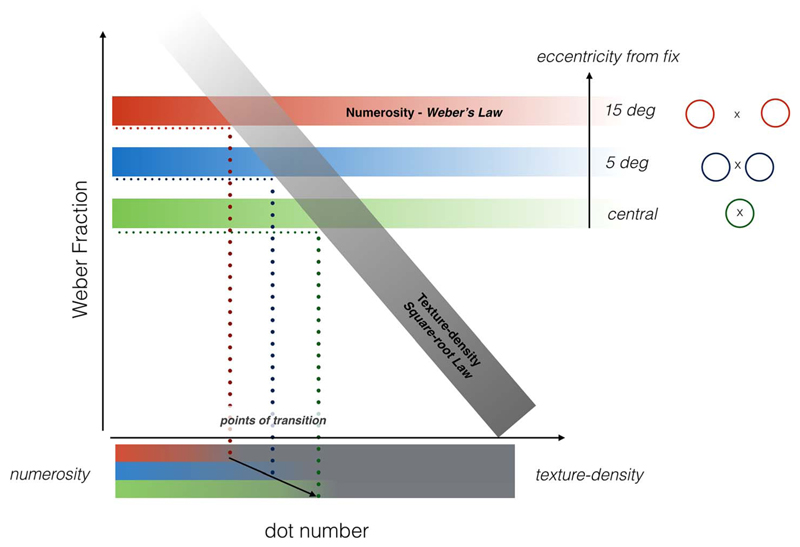
We have recently provided evidence that the perception of number and texture density is mediated by two independent mechanisms: numerosity mechanisms at relatively low numbers, obeying Weber's law, and texture-density mechanisms at higher numerosities, following a square root law. In this study we investigated whether the switch between the two mechanisms depends on the capacity to segregate individual dots, and therefore follows similar laws to those governing visual crowding. We measured numerosity discrimination for a wide range of numerosities at three eccentricities. We found that the point where the numerosity regime (Weber's law) gave way to the density regime (square root law) depended on eccentricity. In central vision, the regime changed at 2.3 dots/°2, while at 15° eccentricity, it changed at 0.5 dots/°2, three times less dense. As a consequence, thresholds for low numerosities increased with eccentricity, while at higher numerosities thresholds remained constant. We further showed that like crowding, the regime change was independent of dot size, depending on distance between dot centers, not distance between dot edges or ink coverage. Performance was not affected by stimulus contrast or blur, indicating that the transition does not depend on low-level stimulus properties. Our results reinforce the notion that numerosity and texture are mediated by two distinct processes, depending on whether the individual elements are perceptually segregable. Which mechanism is engaged follows laws that determine crowding.


Figures

Figure 1
Figure 1
Stimuli and procedure. Each trial started with a central fixation point lasting for 1 s, then two patches of dots were presented for 200 ms. Subjects were asked to indicate which of the two patches contained more dots by appropriate key-press. In separate sessions, stimuli were presented centrally, or centered at 5° or 15° left and right of fixation point. In the central condition, the two patches were presented sequentially with an interstimulus interval of 450 ms. Box at right: examples of blurred stimuli for two sample numerosities (24 at left, 250 right). The blur of the dots was manipulated by convolving a raw image of a dot with Gaussian filters of various standard deviations corresponding to Gaussians with full width at half height of 0.05, 0.12, 0.25, 0.5 and 1 degrees of visual angle.
Figure 2
Figure 2
(A) Geometrical means of Weber Fraction as a function of numerosity, for the three conditions (central-green, 5° eccentricity-blue, and 15° eccentricity-red). Numerosity ranged from 6 to 300. Continuous lines are two-limb linear functions (on log coordinates) that best fit the data. (B) Numerosity where the regime changed, as function of stimulus eccentricity. Filled squares, (color code as before) report geometrical mean of knee points extracted fitting single subjects data. Open squares represent the knee points obtained fitting the average data across subjects, shown in Figure 2A. Error bars show ±1 SEM.
Figure 3
Figure 3
Effect of eccentricity in the low and high numerosity ranges. Mean Weber fractions for N < N' (black symbols and lines) and N > N' (red symbols and lines) as a function of eccentricity. Dotted lines show 95% CI, error bars ±1 SEM.
Figure 4
Figure 4
Effect of dots size on transition point. Weber Fractions for three subjects and group mean as a function of tested numerosity divided by the two levels of dots size. Big open squares refer to patches stimuli made by big dots (diameter of 0.58°), small filled symbols by small dots (diameter of 0.25°). Lines are two-limb best fit of the data (blue for small dots data, black is case of large dots).
Figure 5
Figure 5
Weber Fraction (averaged on three subjects) as a function of stimuli occupancy (ratio between covered and uncovered area), for two numerosity levels (N 12, open squares and N 54 filled circles) tested at 5° of eccentricity from the central fixation point. Single dot diameter was varied from 0.25 to 0.75° (for N 54, to prevent overlap between elements, the maximum testable dots size was 0.58°). Continuous lines report best-fitting linear regressions.
Figure 6
Figure 6
Weber fractions as a function of inter-dot distance. Weber fractions for numerosity are plotted as a function of average center-to-center inter-dot distance (A) or average border-to-border distance (B). As in Figure 4, large open squares refer to patches stimuli made by large dots (area of 1.04°), small filled symbols to small dots (diameter of 0.25°). Continuous lines represent two-limb piecewise linear functions which have slope 2α until knee point and are flat thereafter.
Figure 7
Figure 7
Effect of stimulus regularity. Weber fractions for numerosity discrimination as a function of numerosity for two levels of stimuli regularity: patches stimuli composed by randomly displayed dots (squares) or spaced dots (circles). For peripheral (A) as well as central (B) presentation the switching points for the curve fits remain similar.
Figure 8
Figure 8
(A) Subjects geometrical mean of Weber fraction measured with sequentially (green symbols) or simultaneously presented stimuli at 15° of eccentricity from central fixation point. (B) mean Weber fraction as a function of dots contrast or blur (C) level for two different level of numerosity.
Figure 9
Figure 9
Concept of the two separate perceptual mechanisms subserving numerosity discrimination. Sparse stimuli (low numerosities) are sensed by a mechanism obeying Weber's Law (threshold proportional to numerosity), which is dependent on eccentricity (red, blue, and green bars). Texture-discrimination mechanisms (gray bar) come into play with more packed stimuli (higher numerosity): Its threshold decreases with the square root of numerosity. This mechanism does not depend on eccentricity. When comparing the relative numerosity of two patches of items, subjects were free to use any criterion: As the presentation area was kept constant, both texture-density and number were equally valid. According to this model, the measured performance should yield a two-limbed function because subjects rely on the more sensitive mechanism for that specific numerosity level. As the Numerosity mechanism is less precise as eccentricity increase, the transition point between those two mechanisms depends on eccentricity.

References

    1. Anobile G, Cicchini GM, Burr DC. Separate mechanisms for perception of numerosity and density. Psychological Science. 2014;25(1):265–270. doi: 10.1177/0956797613501520. - DOI - PubMed
    1. Anobile G, Stievano P, Burr DC. Visual sustained attention and numerosity sensitivity correlate with math achievement in children. Journal of Experimental Child Psychology. 2013;116(2):380–391. doi: 10.1016/J.Jecp.2013.06.006. - DOI - PubMed
    1. Arrighi R, Togoli I, Burr DC. A generalized sense of number. Proceedings of the Royal Society B. 2014;281(1797):20141791. doi: 10.1098/rspb.2014.1791. - DOI - PMC - PubMed
    1. Bex PJ, Dakin SC. Spatial interference among moving targets. Vision Research. 2005;45(11):1385–1398. - PubMed
    1. Bouma H. Interaction effects in parafoveal letter recognition. Nature. 1970;226(5241):177–178. - PubMed

Publication types