. 2015 Oct;156(10):1965-1977.
doi: 10.1097/j.pain.0000000000000258.

Molecular genetic mechanisms of allelic specific regulation of murine Comt expression

Affiliations

Molecular genetic mechanisms of allelic specific regulation of murine Comt expression

Samantha K Segall et al. Pain. 2015 Oct.

Abstract

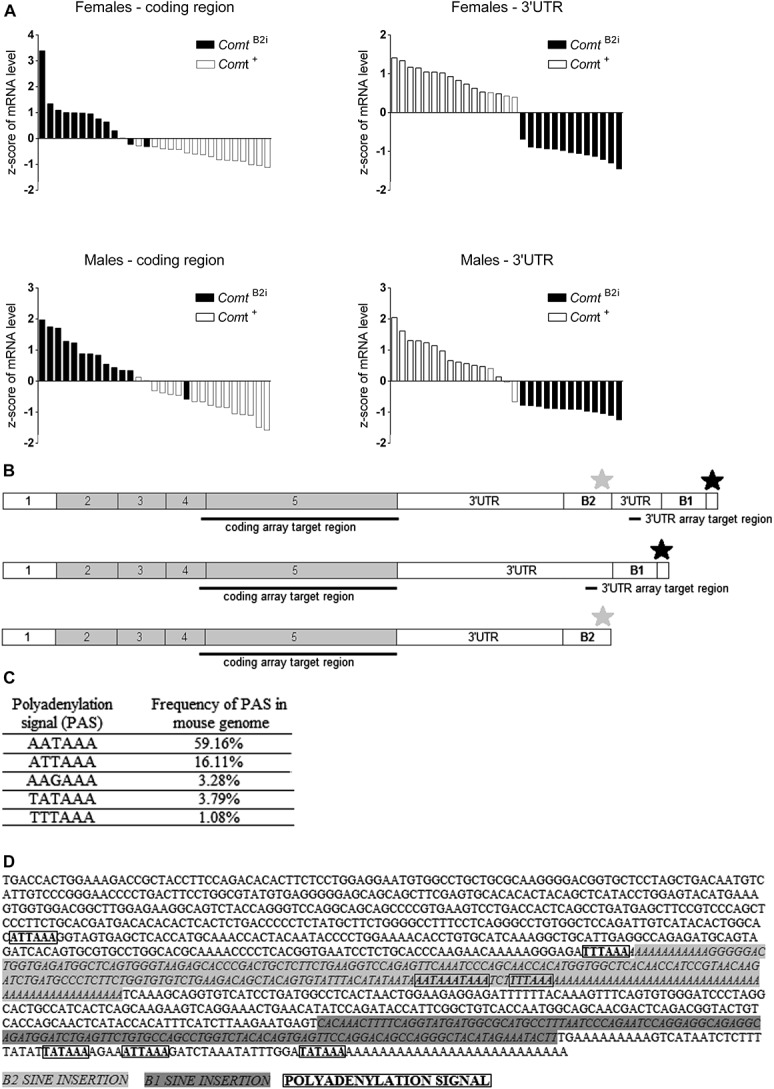
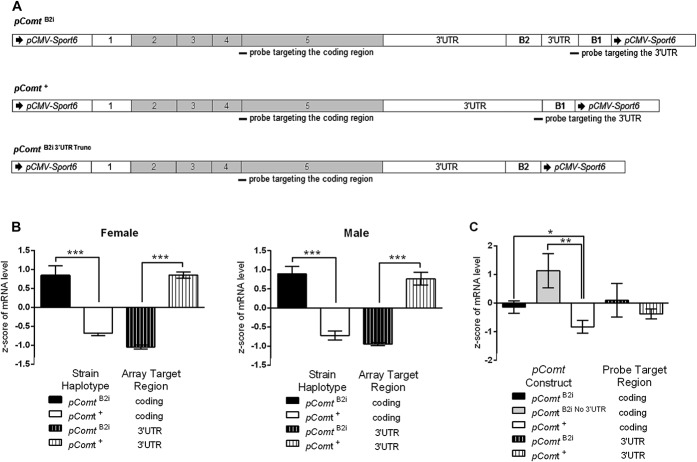
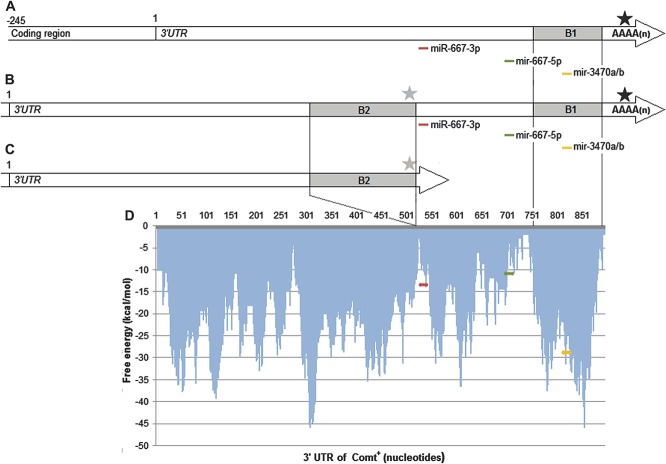
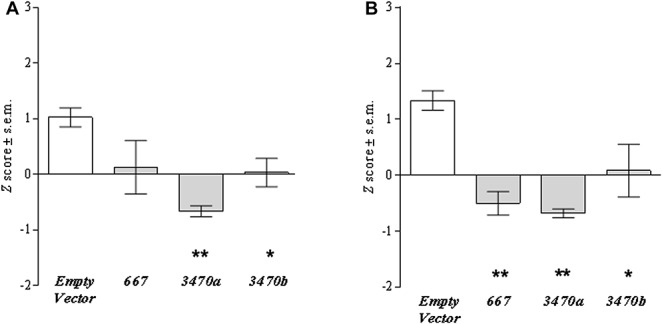
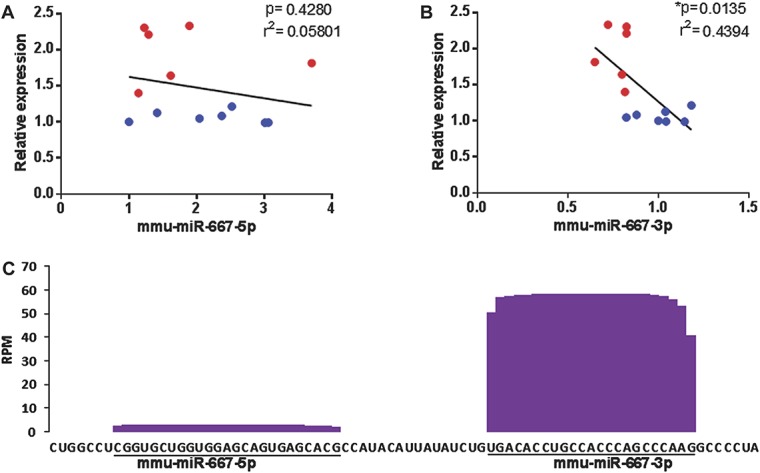
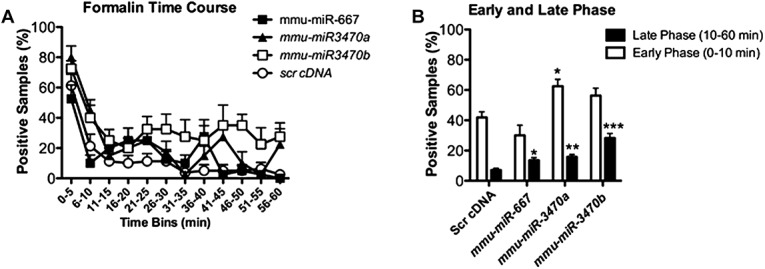
A functional allele of the mouse catechol-O-methyltransferase (Comt) gene is defined by the insertion of a B2 short interspersed repeat element in its 3'-untranslated region (UTR). This allele has been associated with a number of phenotypes, such as pain and anxiety. In comparison with mice carrying the ancestral allele (Comt+), Comt B2i mice show higher Comt mRNA and enzymatic activity levels. Here, we investigated the molecular genetic mechanisms underlying this allelic specific regulation of Comt expression. Insertion of the B2 element introduces an early polyadenylation signal generating a shorter Comt transcript, in addition to the longer ancestral mRNA. Comparative analysis and in silico prediction of Comt mRNA potential targets within the transcript 3' to the B2 element was performed and allowed choosing microRNA (miRNA) candidates for experimental screening: mmu-miR-3470a, mmu-miR-3470b, and mmu-miR-667. Cell transfection with each miRNA downregulated the expression of the ancestral transcript and COMT enzymatic activity. Our in vivo experiments showed that mmu-miR-667-3p is strongly correlated with decreasing amounts of Comt mRNA in the brain, and lentiviral injections of mmu-miR-3470a, mmu-miR-3470b, and mmu-miR-667 increase hypersensitivity in the mouse formalin model, consistent with reduced COMT activity. In summary, our data demonstrate that the Comt+ transcript contains regulatory miRNA signals in its 3'-untranslated region leading to mRNA degradation; these signals, however, are absent in the shorter transcript, resulting in higher mRNA expression and activity levels.


Conflict of interest statement

Sponsorships or competing interests that may be relevant to content are disclosed at the end of this article.

Figures

Figure 1
Figure 1
Microarray hybridization pattern of coding vs 3′-UTR regions for mouse Comt mRNA expressed by 29 Comt+ and ComtB2i mouse inbred lines. (A) The Affymetrix array reveals bimodal Comt expression hybridization patterns in coding (left) vs 3′-UTR (right) regions. Each bar represents the z score of 1 inbred line. Inbred mouse lines carrying the ancestral allele, Comt+ (white bars), have greater mRNA hybridization signal in the 3′-UTR than in the coding region, whereas strains carrying the ComtB2i allele (black bars) have the opposite hybridization profile in both female (top) and male (bottom) animals. The representative expression profile of prefrontal cortex is presented; see Supplementary Figures 1 to 4 for other brain regions. (B) Schematics of the ancestral (Comt+, top) and of the 2 alternative (ComtB2i, middle and bottom) allelic transcripts showing the coding and 3′-UTR array target regions, the B1 and B2 SINE transposons, and the ancestral (black star) and alternative (grey star) PASs. The alternative ComtB2i allele can generate both a full-length transcript containing B2 SINE transposon sequence (middle) and a shorter transcript that ends after the B2 SINE-inserted PAS (bottom). (C) Sequence of PAS hexamers and frequency found in the mouse genome, reported by Tian et al. (D) Sequence of the full-length ComtB2i transcript with marked B2 SINE and B1 transposons, as well as the ancestral and alternative PASs.
Figure 2
Figure 2
Comparison of expression levels of Comt+ and ComtB2i transcripts in vivo and in vitro. (A) The pComt+ construct has the entire ancestral sequence of Comt transcript (NM_001111063); the pComtB2i construct contains the same entire sequence with the B2 SINE insertion; the pComtB2i No 3-UTR has the sequence after the major PAS within the B2 SINE removed. (B) In vivo Comt mRNA expression levels in the PFC of Comt+ and ComtB2i female and male animals measured in the coding and 3′-UTR regions. Z scores show that ComtB2i animals have significantly higher expression level than Comt+ animals when Comt is measured in the coding region, and significantly lower expression levels when Comt is measured in the 3′-UTR. (C) In vitro Comt mRNA expression levels in cells transfected with pComt+ or one of the 2 pComtB2i constructs measured in the coding and 3′-UTR regions. Z scores show that transfections with the pComtB2i construct result in higher expression level than with the pComt+ when Comt is measured in the coding region; in contrast with in vivo results, when Comt is measured in the 3′-UTR, transfection with the pComtB2i or the pComt+ construct results in similar expression levels. The pComtB2i No 3-UTR mimics the shorter alternative ComtB2i transcript in the mouse generated by utilization of the alternative PAS, and transfection with it results in higher expression level than that of pComt+ when Comt is measured in the coding region. Significance is denoted as * for P < 0.05, ** for P < 0.01, and ***for P < 0.0001.
Figure 3
Figure 3
Predicted miRNA sites and profile of free energy of target accessibility in the 3′-UTR of the murine Comt gene. (A) Alignment of the 3 predicted murine miRNA target positions to the 3′-UTR of Comt+ and location of ancestral PAS (black star); (B) alignment of the 3 predicted murine miRNA target positions to the 3′-UTR of ComtB2i and location of the ancestral PAS (black star) and alternative PAS (gray star), when the full transcript is made in ComtB2i animals; (C) when the alternative PAS (gray star) is used in ComtB2i animals, the 3 predicted miRNA target sites for mmu-miR-667-3/-5 and mmu-miR-3470a/b are absent; (D) target locations for mmu-miR-667-3p (in red), mmu-miR-667-5p (in green), for mmu-miR-3470a or mmu-miR-3470b (in yellow) and their respective free energy (kcal/mol).
Figure 4
Figure 4
Effect of cell transfection with each miRNA expression construct on Comt mRNA expression levels and enzymatic activities. The pComt+ construct was cotransfected with pSEAP and either pmiR-Empty Vector, pmiR-667, pmiR-3470a, or pmiR-3470b; Comt mRNA expression was measured in the coding region, and SEAP activity was used for normalization of transfection efficiency. (A) Comt mRNA expression levels and (B) enzymatic activity in each transfected sample were compared with that of pComt+ cotransfected with pmiR-Empty Vector. Transfection with all miRNAs downregulated mRNA expression level and enzymatic activity, although the downregulation of mRNA expression by miR-667 did not reach significance (P = 0.0578). Significance is denoted as * for P < 0.05, ** for P < 0.01.
Figure 5
Figure 5
Correlation between relative mRNA expression levels of Comt and mmu-miR-667-3p or mmu-miR-667-5p. (A and B) RT-PCR results were generated on the independent cohort of 4 mouse strains: AKR/J and BALB/cByJ (ComtB2i strains), and C3H/HeJ and SJL/J (Comt+ strains). Relative Comt mRNA levels were measured in the coding region and plotted against relative miRNA levels from the same sample. Each data point represents a single mouse from the ComtB2i (red) or Comt+ (blue) strains. Results show (A) a strong negative correlation between increasing amounts of mmu-miR-667-3p and decreasing amounts of Comt transcript and (B) no correlation between amounts of mmu-miR-667-5p and Comt transcript. (C) RNA-seq read coverage of the mature mmu-miR-667-5p and mmu-miR-667-3p in mouse tissues and cell lines. The number of reads per million (RPM) of assessed mouse tissues (brain, testis, ovary, spleen, bone marrow, skin, and salivary glands) and cell line is presented.
Figure 6
Figure 6
Intraplantar injection of mmu-miR-667, mmu-miR-3470a, and mmu-miR-3470b increases hypersensitivity on the formalin assay of nocifensive behavior. (A) The time course data for licking in the formalin test are presented for day 21 post-miRNA intraplantar injection. (B) The averaged data for the early (0-10 minutes) and late (10-60 minutes) phases of the formalin test are shown. Only mmu-miR-3470a increased licking during the early phase; however, all 3 miRNAs increased licking during the late phase of the assay when compared with scrambled cDNA (scr cDNA). Statistical analyses were performed using a 1-way ANOVA and compared all groups on either the early or late phase separately; n = 8 per group. Significance is denoted as * for P < 0.05, ** for P < 0.01, and *** for P < 0.0001.

References

    1. Batzer MA, Deininger PL. Alu repeats and human genomic diversity. Nat Rev Genet 2002;3:370–9. - PubMed
    1. Belfer I, Segall SK, Lariviere WR, Smith SB, Dai F, Slade GD, Rashid NU, Mogil JS, Campbell CM, Edwards RR, Liu Q, Bair E, Maixner W, Diatchenko L. Pain modality- and sex-specific effects of COMT genetic functional variants. PAIN 2013;154:1368–76. - PMC - PubMed
    1. Bevilacqua L, Goldman D. Genetics of emotion. Trends Cogn Sci 2011;15:401–8. - PMC - PubMed
    1. Bray NJ, Buckland PR, Williams NM, Williams HJ, Norton N, Owen MJ, O'Donovan MC. A haplotype implicated in schizophrenia susceptibility is associated with reduced COMT expression in human brain. Am J Hum Genet 2003;73:152–61. - PMC - PubMed
    1. Buckert M, Kudielka BM, Reuter M, Fiebach CJ. The COMT Val158Met polymorphism modulates working memory performance under acute stress. Psychoneuroendocrinology 2012;37:1810–21. - PubMed

Publication types

MeSH terms