. 2015 Jun 10;4(2):397-423.
doi: 10.3390/biology4020397.

Simultaneous Pathoproteomic Evaluation of the Dystrophin-Glycoprotein Complex and Secondary Changes in the mdx-4cv Mouse Model of Duchenne Muscular Dystrophy

Affiliations

Simultaneous Pathoproteomic Evaluation of the Dystrophin-Glycoprotein Complex and Secondary Changes in the mdx-4cv Mouse Model of Duchenne Muscular Dystrophy

Sandra Murphy et al. Biology (Basel). .

Abstract

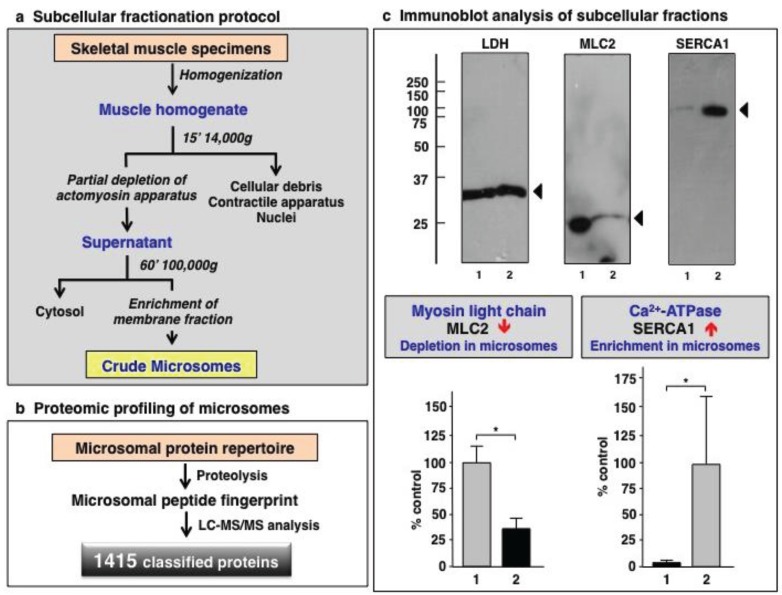
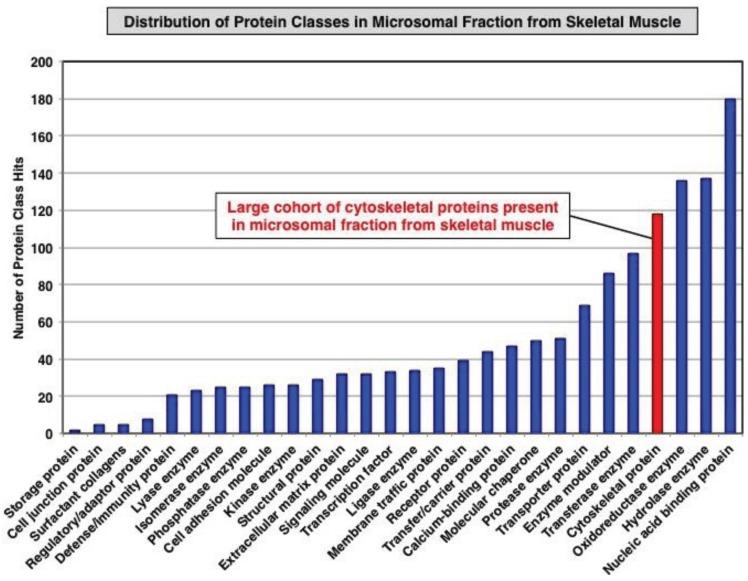
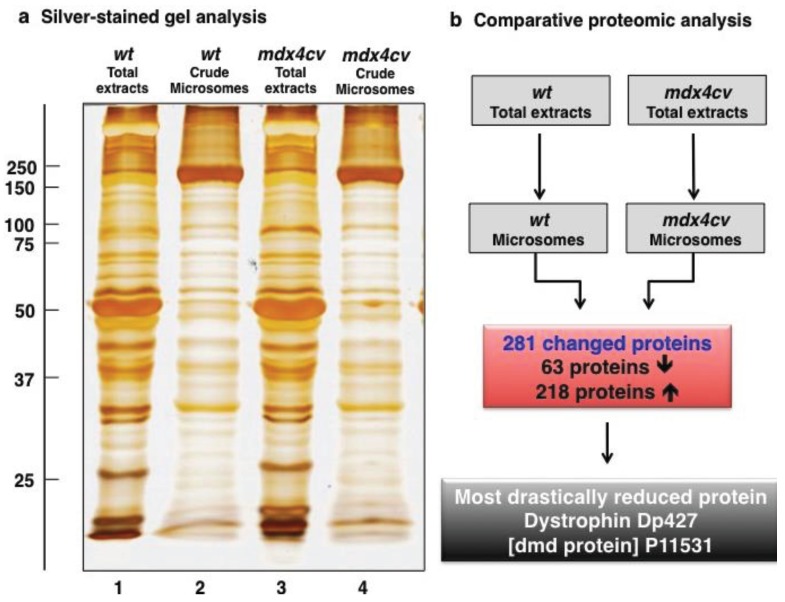
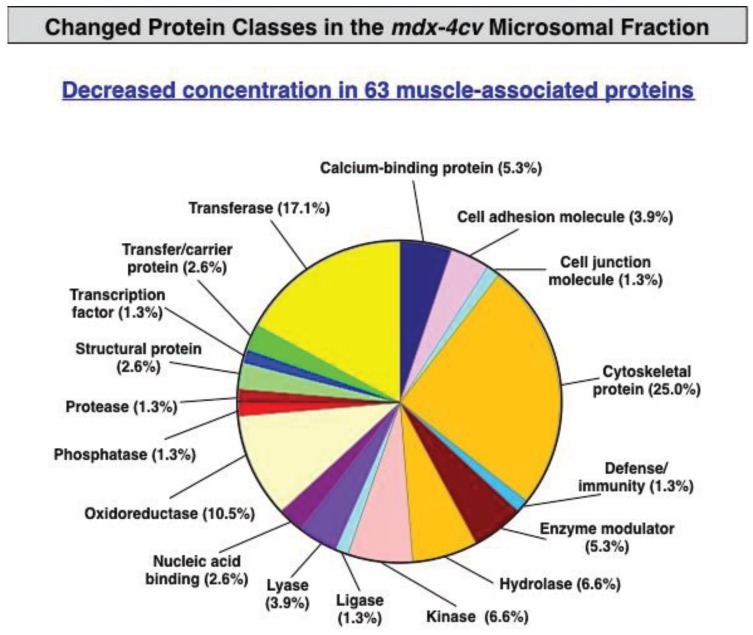
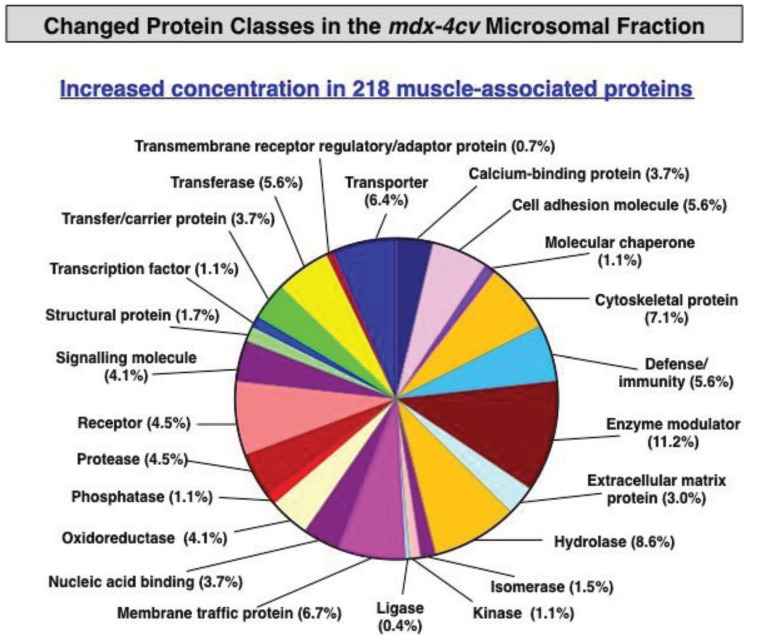
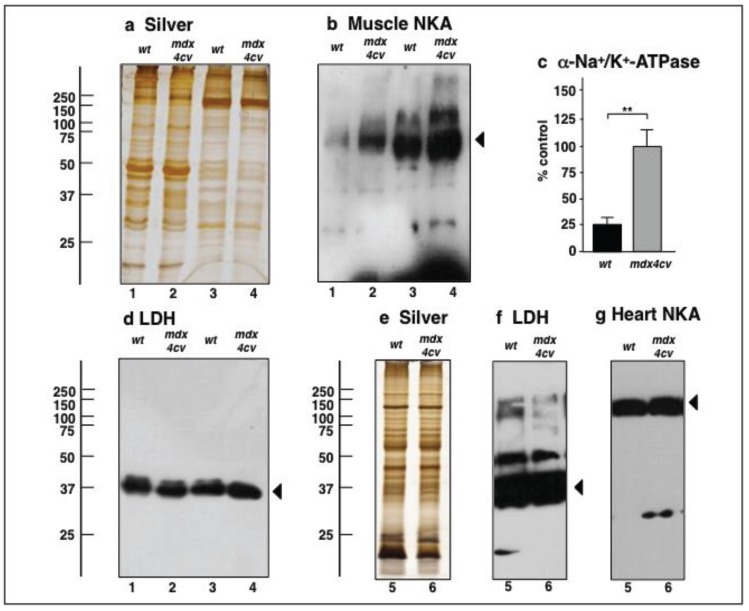
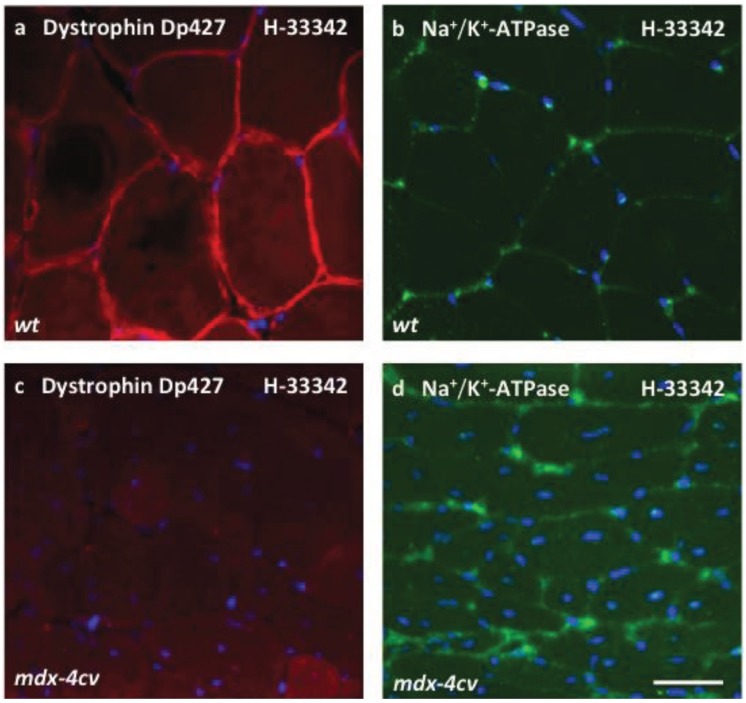
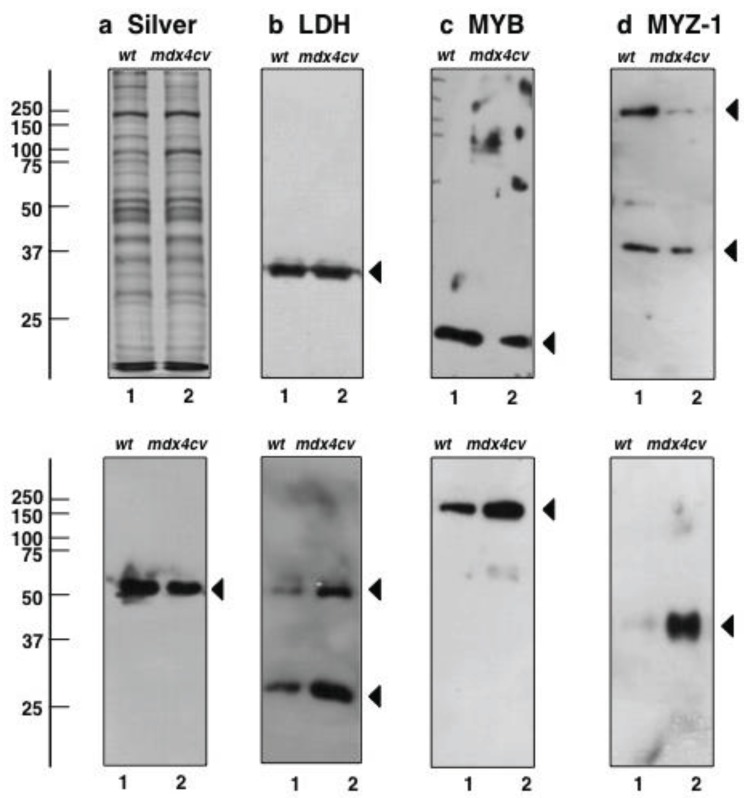
In skeletal muscle, the dystrophin-glycoprotein complex forms a membrane-associated assembly of relatively low abundance, making its detailed proteomic characterization in normal versus dystrophic tissues technically challenging. To overcome this analytical problem, we have enriched the muscle membrane fraction by a minimal differential centrifugation step followed by the comprehensive label-free mass spectrometric analysis of microsomal membrane preparations. This organelle proteomic approach successfully identified dystrophin and its binding partners in normal versus dystrophic hind limb muscles. The introduction of a simple pre-fractionation step enabled the simultaneous proteomic comparison of the reduction in the dystrophin-glycoprotein complex and secondary changes in the mdx-4cv mouse model of dystrophinopathy in a single analytical run. The proteomic screening of the microsomal fraction from dystrophic hind limb muscle identified the full-length dystrophin isoform Dp427 as the most drastically reduced protein in dystrophinopathy, demonstrating the remarkable analytical power of comparative muscle proteomics. Secondary pathoproteomic expression patterns were established for 281 proteins, including dystrophin-associated proteins and components involved in metabolism, signalling, contraction, ion-regulation, protein folding, the extracellular matrix and the cytoskeleton. Key findings were verified by immunoblotting. Increased levels of the sarcolemmal Na+/K+-ATPase in dystrophic leg muscles were also confirmed by immunofluorescence microscopy. Thus, the reduction of sample complexity in organelle-focused proteomics can be advantageous for the profiling of supramolecular protein complexes in highly intricate systems, such as skeletal muscle tissue.

Keywords: Na+/K+-ATPase; dystroglycan; dystrophin; dystrophinopathy; myozenin; organelle proteomics; periostin; sarcoglycan; syntrophin; tubulin.


Figures

Figure 1
Figure 1
(a) Flowchart of the subcellular fractionation approach used in this proteomic study for the isolation of crude microsomes from skeletal muscle. (b) Overview of the mass spectrometric profiling of the microsomal subproteome. (c) Immunoblot analysis of lactate dehydrogenase (LDH; as loading control), myosin light chain isoform MLC2 and the sarcoplasmic reticulum Ca2+-ATPase isoform SERCA1. Arrowheads indicate immuno-labelled bands. Lanes 1 and 2 represent total muscle extracts and the microsomal fraction, respectively. Graphical presentations show the statistical analysis of immunoblotting of the contractile apparatus marker MLC2 versus the membrane fraction marker SERCA1 (Student’s t-test, unpaired; n = 4; * p < 0.05).
Figure 2
Figure 2
Overview of the distribution of protein classes present in the microsomal fraction from skeletal muscle as judged by label-free LC-MS/MS analysis and the bioinformatics listing according to the PANTHER database of protein families for the cataloguing of molecular functions [58].
Figure 3
Figure 3
(a) Gel electrophoretic analysis of total muscle extracts (lanes 1 and 3) and the crude microsomal muscle fraction (lanes 2 and 4) from wild type (wt; lanes 1 and 2) versus dystrophic mdx-4cv (lanes 3 and 4) mice. Molecular mass standards (in kDa) are marked to the left of the panel. (b) Overview of the findings from the comparative proteomic analysis of the microsomal fraction from dystrophic versus wild type muscle.
Figure 4
Figure 4
Summary of changed protein classes with a reduced abundance in mdx-4cv hind limb muscle. The bioinformatics software programme PANTHER [57,58] was applied to identify the clustering of protein classes based on the mass spectrometric analysis of the microsomal fraction from dystrophic versus control specimens (Table 1 and Table S1).
Figure 5
Figure 5
Summary of changed protein classes with an increased abundance in mdx-4cv hind limb muscle. The bioinformatics software programme PANTHER [57,58] was applied to identify the clustering of protein classes based on the mass spectrometric analysis of the microsomal fraction from dystrophic versus control specimens (Table 2 and Table S2).
Figure 6
Figure 6
Immunoblot analysis of the Na+/K+-ATPase from mdx-4cv skeletal and cardiac muscles. Shown are representative silver-stained gels (a,e) and immunoblots (b,d,f,g). Lanes 1 to 6 represent total extracts from non-dystrophic wild type (wt) skeletal muscle, total extracts from dystrophic mdx-4cv skeletal muscle, crude microsomes from wt skeletal muscle, crude microsomes form mdx-4cv skeletal muscle, total extracts from wt heart, and total extracts from mdx-4cv heart, respectively. Blots were labelled with antibodies to the Na+/K+-ATPase (b,g), and lactate dehydrogenase (LDH; as a loading control) (d,f). Arrowheads indicate immuno-labelled bands. Graphical representations of the immuno-decoration levels for the Na+/K+-ATPase in normal versus mdx-4cv microsomes are shown in panel (c): Student’s t-test, unpaired; n = 4; ** p < 0.01. See supplementary Figure S2 for the graphical presentation of LDH and the cardiac Na+/K+-ATPase.
Figure 7
Figure 7
Immunofluorescence microscopical analysis of dystrophin and the Na+/K+-ATPase in mdx-4cv gastrocnemius muscle. Shown is the labelling of nuclei with the DNA binding dye bis-benzimide Hoechst 33342 (H-33342) (ad), as well as antibody labelling of the full-length dystrophin isoform Dp427 (a,c) and the Na+/K+-ATPase (b,d) in wild type (wt) (a,b) versus dystrophic mdx-4cv (c,d) gastrocnemius muscle. The immunofluorescence microscopical analysis of dystrophin-deficient muscle fibres indicates a higher degree of central nucleation and increased levels of the sarcolemmal Na+/K+-ATPase. The bar equals 20 μm.
Figure 8
Figure 8
Immunoblot analysis of proteins with a considerable change in concentration levels in mdx-4cv skeletal muscle tissue. Shown is a silver-stained gel (a) and representative immunoblots (bh). Lanes 1 and 2 represent crude microsomes from wild type muscle and dystrophic mdx-4cv muscle, respectively. Blots were labeled with antibodies to lactate dehydrogenase (LDH) (b), myoglobin (MYB) (c), myozenin (MYZ-1) (d), pyruvate dehydrogenase (PDH) (e), β-tubulin (β-TUB) (f), periostin (POSTN) (g) and vimentin (VIM) (h). The graphical representations of immuno-decoration levels are shown in supplementary Figure S3. Arrowheads indicate immuno-labelled bands. In the case of myozenin and tubulin, high-molecular-mass bands were detected besides the main isoforms, possibly representing larger protein aggregates.

References

    1. Geiger T., Velic A., Macek B., Lundberg E., Kampf C., Nagaraj N., Uhlen M., Cox J., Mann M. Initial quantitative proteomic map of 28 mouse tissues using the SILAC mouse. Mol. Cell. Proteomics. 2013;12:1709–1722. doi: 10.1074/mcp.M112.024919. - DOI - PMC - PubMed
    1. Højlund K., Yi Z., Hwang H., Bowen B., Lefort N., Flynn C.R., Langlais P., Weintraub S.T., Mandarino L.J. Characterization of the human skeletal muscle proteome by one-dimensional gel electrophoresis and HPLC-ESI-MS/MS. Mol. Cell. Proteomics. 2008;7:257–267. doi: 10.1074/mcp.M700304-MCP200. - DOI - PMC - PubMed
    1. Raddatz K., Albrecht D., Hochgräfe F., Hecker M., Gotthardt M. A proteome map of murine heart and skeletal muscle. Proteomics. 2008;8:1885–1897. doi: 10.1002/pmic.200700902. - DOI - PubMed
    1. Parker K.C., Walsh R.J., Salajegheh M., Amato A.A., Krastins B., Sarracino D.A., Greenberg S.A. Characterization of human skeletal muscle biopsy samples using shotgun proteomics. J. Proteome Res. 2009;8:3265–3277. doi: 10.1021/pr800873q. - DOI - PubMed
    1. Burniston J.G., Connolly J., Kainulainen H., Britton S.L., Koch L.G. Label-free profiling of skeletal muscle using high-definition mass spectrometry. Proteomics. 2014;14:2339–2344. doi: 10.1002/pmic.201400118. - DOI - PMC - PubMed

LinkOut - more resources