. 2015 Jun 11;10(6):e0129781.
doi: 10.1371/journal.pone.0129781. eCollection 2015.

Dawn and Dusk Set States of the Circadian Oscillator in Sprouting Barley (Hordeum vulgare) Seedlings

Affiliations

Dawn and Dusk Set States of the Circadian Oscillator in Sprouting Barley (Hordeum vulgare) Seedlings

Weiwei Deng et al. PLoS One. .

Erratum in

Abstract

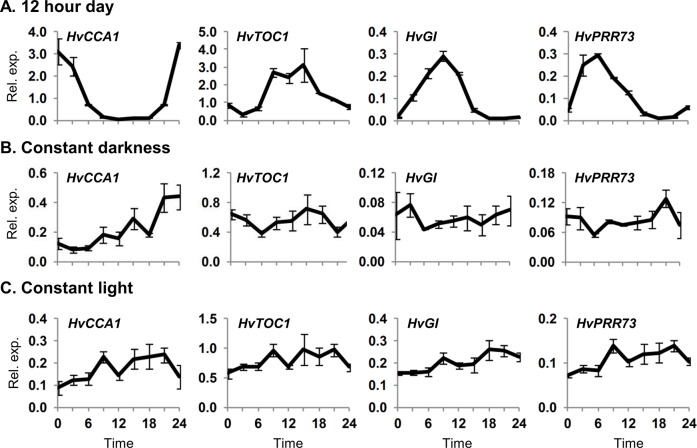
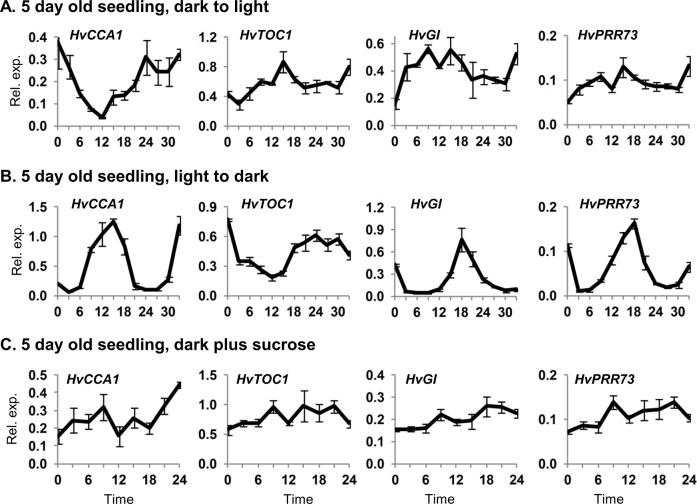
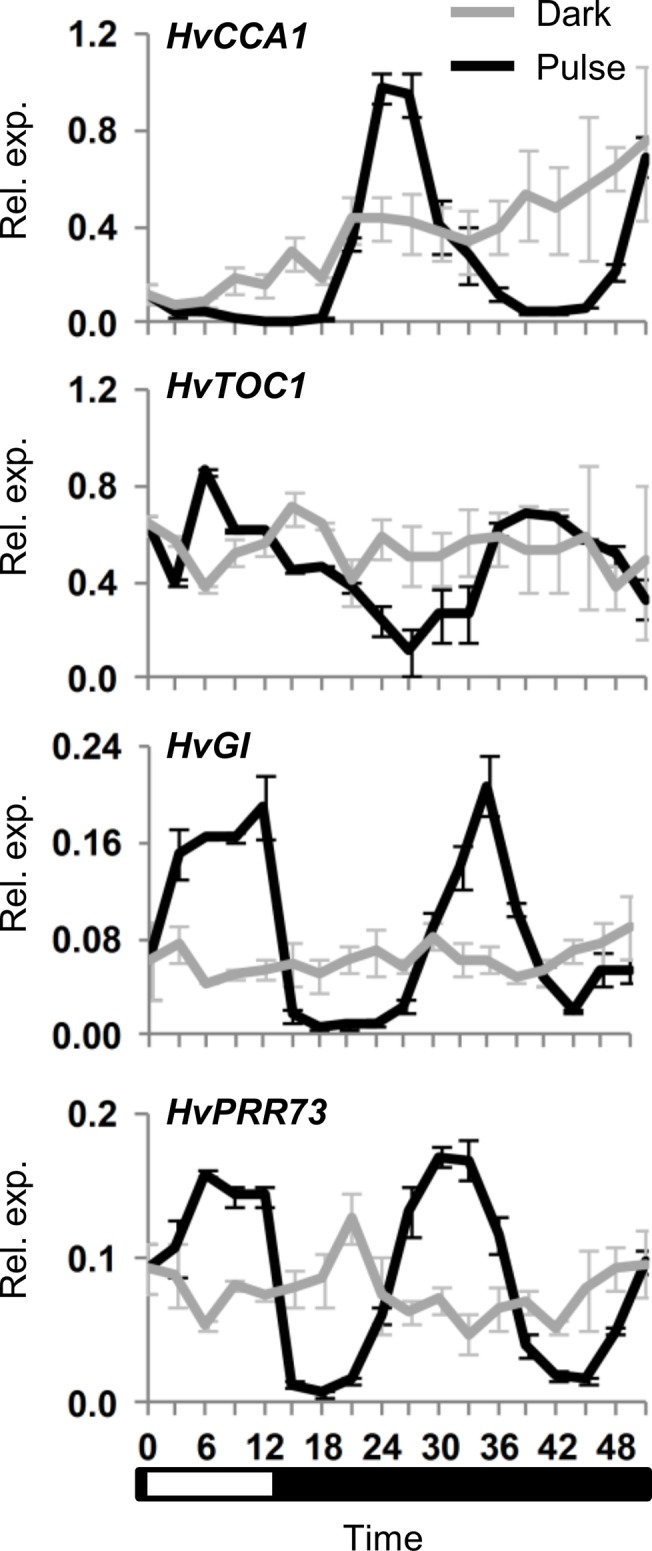
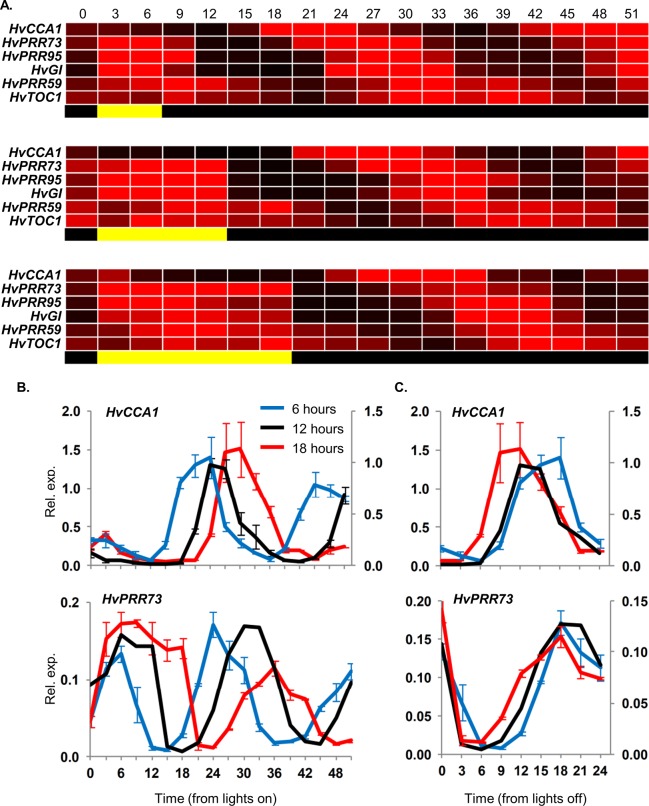
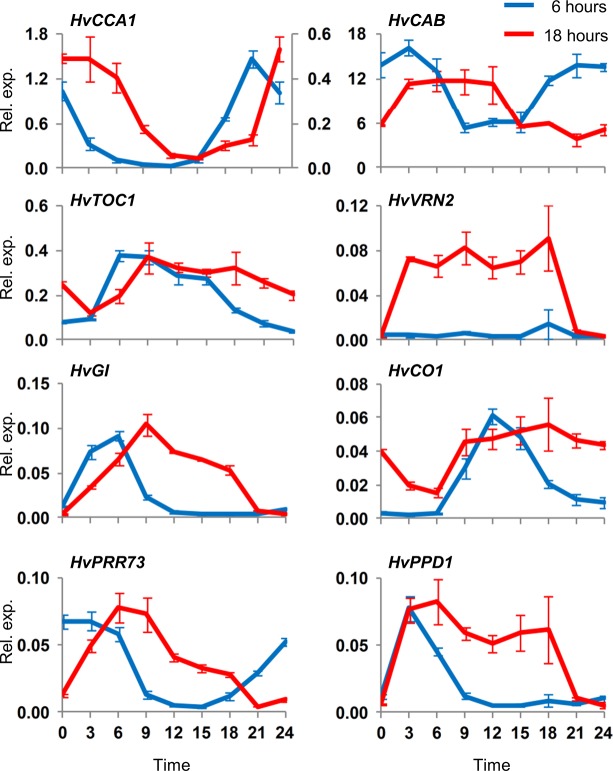
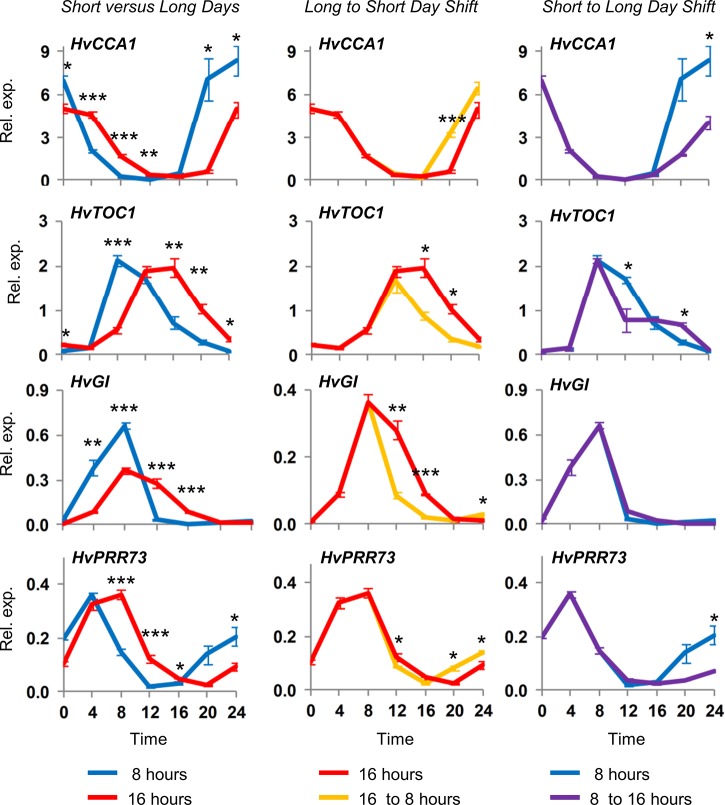
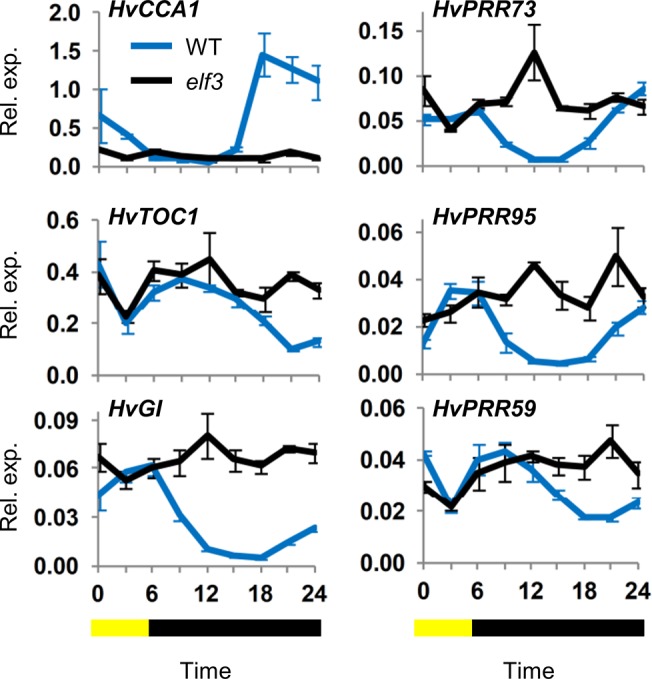
The plant circadian clock is an internal timekeeper that coordinates biological processes with daily changes in the external environment. The transcript levels of clock genes, which oscillate to control circadian outputs, were examined during early seedling development in barley (Hordeum vulgare), a model for temperate cereal crops. Oscillations of clock gene transcript levels do not occur in barley seedlings grown in darkness or constant light but were observed with day-night cycles. A dark-to-light transition influenced transcript levels of some clock genes but triggered only weak oscillations of gene expression, whereas a light-to-dark transition triggered robust oscillations. Single light pulses of 6, 12 or 18 hours induced robust oscillations. The light-to-dark transition was the primary determinant of the timing of subsequent peaks of clock gene expression. After the light-to-dark transition the timing of peak transcript levels of clock gene also varied depending on the length of the preceding light pulse. Thus, a single photoperiod can trigger initiation of photoperiod-dependent circadian rhythms in barley seedlings. Photoperiod-specific rhythms of clock gene expression were observed in two week old barley plants. Changing the timing of dusk altered clock gene expression patterns within a single day, showing that alteration of circadian oscillator behaviour is amongst the most rapid molecular responses to changing photoperiod in barley. A barley EARLY FLOWERING3 mutant, which exhibits rapid photoperiod-insensitive flowering behaviour, does not establish clock rhythms in response to a single photoperiod. The data presented show that dawn and dusk cues are important signals for setting the state of the circadian oscillator during early development of barley and that the circadian oscillator of barley exhibits photoperiod-dependent oscillation states.


Conflict of interest statement

Competing Interests: The authors have declared that no competing interests exist.

Figures

Fig 1
Fig 1. Expression of clock genes assayed in barley seedlings grown in different light regimes.
Clock gene expression assayed by quantitative reverse transcriptase PCR (qRT-PCR) in 5 day old barley seedlings (cv. Sonja) germinated and grown in constant temperature conditions (20°C) with (A) 12 hour day-night cycles with light from hours 0 to 12, (B) constant darkness or (C) constant light. Average expression in RNA extracted from individual seedlings (3 biological repeats) is shown relative to ACTIN (Rel. exp.), error bars show standard error. Horizontal axis labels indicate the time (hours) relative to when the first sample was harvested. Samples were harvested directly from the described conditions (i.e. without free running conditions for the day-night cycle samples).
Fig 2
Fig 2. Clock gene expression after light/dark transitions or with exogenous sucrose.
Gene expression, assayed by qRT-PCR, in 5 day old barley seedlings (cv. Sonja) germinated and grown in: (A) constant darkness then shifted to light, (B) constant light then shifted to darkness or (C) constant darkness plus 2% sucrose. RNA was extracted from 3 biological repeats. Average expression is shown relative to ACTIN (Rel. exp.), error bars show standard error. Horizontal axis labels indicate the time (hours) relative to when the first sample was harvested and treatments began.
Fig 3
Fig 3. Initiation of circadian oscillations following a single light pulse.
Clock gene expression, assayed by qRT-PCR, in 5 day old barley seedlings (cv. Sonja) germinated and grown in constant darkness then exposed to a 12 hour light pulse (black line) versus control plants maintained in darkness (grey line). RNA was extracted from 3 biological repeats. Average expression is shown relative to ACTIN (Rel. exp.), error bars show standard error. Horizontal axis labels indicate the time (hours) relative to when the first sample was harvested. The white and black bar indicates duration of the light period relative to sampling timepoints (white corresponds to the light period).
Fig 4
Fig 4. Initiation of circadian oscillations following single light pulses of different durations.
(A) Heat map of clock gene expression, assayed by qRT-PCR, in 5 day old barley seedlings (cv. Sonja) germinated and grown in constant darkness then exposed to a single light pulse of 6, 12 or 18 hours. Expression is presented ranged from 0 (black) to 2-fold increase (red) in transcript levels, relative to median expression of that gene across all timepoints in the specific experiment. Light treatments are represented by yellow and black bars beneath each heatmap. (B) Transcript levels of HvCCA1 and HvPRR73 in the same experiment with single light pulses of 6 (blue line), 12 (black line) or 18 hours (red line), plotted from the start of the light pulse treatments. (C) Transcript levels of HvCCA1 and HvPRR73 from the end of the light pulses (dusk). RNA was extracted from 3 biological repeats. Average expression is shown relative to ACTIN (Rel. exp.), error bars show standard error. Relative transcript levels varied between treatments so two y-axes were used to allow easy comparison of overall rhythms; the 18 hour treatment is shown on the secondary axis (right-hand side). Horizontal axis labels indicate the time (hours) relative to when the first sample was harvested.
Fig 5
Fig 5. Photoperiod dependence of circadian oscillations in barley seedlings.
Transcript levels of clock or clock-regulated genes, assayed by qRT-PCR, in 5 day old barley seedlings (cv. Sonja) germinated and grown in 6 (blue line) or 18 hour daylengths (red line). Dawn was synchronised between the two photoperiod treatments. RNA was extracted from 3 biological repeats. Average expression is shown relative to ACTIN (Rel. exp.), error bars show standard error. Horizontal axis labels indicate the time (hours) relative to dawn when the first sample was harvested.
Fig 6
Fig 6. Dynamic response of circadian oscillations to daylength shifts.
Barley seedlings (cv. Sonja) were germinated and grown in 8 hour or 16 hour days, for 14 days (second leaf stage), with dawn synchronous in the two daylengths. On the 14th day plants were shifted from 8 to 16 hour days and vice versa. Shifts occurred 8 hours after dawn shortly before the onset of darkness in the short-day condition. Gene expression was then assayed by qRT-PCR, normalized to ACTIN with 3 biological repeats, in the plants shifted to different daylengths and in control plants maintained in the same daylength. The 8 hour day treatment (blue line) is compared to 16 hours (red line) at the left hand side. The 16 hour day treatment is compared to plants shifted from 16 to 8 hour daylength (long to short days, orange line), centre panel. The 8 hour daylength is compared to seedlings shifted to 16 hours (short to long days, purple line) on the right hand side. Error bars show standard error. * indicates Student’s T-test P<0.05, **P<0.01, ***P<0.001 between treatments for the relevant timepoint.
Fig 7
Fig 7. ELF3 function is required for induction of transcriptional oscillations by a single light pulse.
Transcript levels of clock genes assayed qRT-PCR normalized to ACTIN (average of 3 biological repeats) in 5 day old barley seedlings (cv. Bonus) that were germinated and grown in constant darkness then exposed to a single light pulse of 6 hours (blue line). Expression is compared to a HvELF3 loss-of-function mutant (black line) isolated in the same genetic background. Error bars show standard error. The yellow and black bar indicates duration of light period relative to sampling timepoints.

References

    1. Barak S, Tobin EM, Andronis C, Sugano S, Green RM (2000) All in good time: the Arabidopsis circadian clock. Trends Plant Sci 5: 517–522. - PubMed
    1. McClung CR (2001) Circadian Rhythms in Plants. Ann. Rev. Plant. Biol. 52: 139–162. - PubMed
    1. Millar AJ (2003) Input signals to the plant circadian clock. J Exp Biol 55: 227–283. - PubMed
    1. Schaffer R, Ramsay N, Samach A, Corden S, Putterill J, Carré IA, et al. (1998) The late elongated hypocotyl mutation of Arabidopsis disrupts circadian rhythms and the photoperiodic control of flowering. Cell 93: 1219–1229. - PubMed
    1. Somers DE, Webb AA, Pearson M, Kay SA (1998) The short-period mutant, toc1-1, alters circadian clock regulation of multiple outputs throughout development in Arabidopsis thaliana . Development 125: 485–494. - PubMed

Publication types

LinkOut - more resources