Meta-Analysis
. 2015 Jun 12:6:7208.
doi: 10.1038/ncomms8208.

Genome-wide association study identifies novel genetic variants contributing to variation in blood metabolite levels

Affiliations
Meta-Analysis

Genome-wide association study identifies novel genetic variants contributing to variation in blood metabolite levels

Harmen H M Draisma et al. Nat Commun. .

Abstract

Metabolites are small molecules involved in cellular metabolism, which can be detected in biological samples using metabolomic techniques. Here we present the results of genome-wide association and meta-analyses for variation in the blood serum levels of 129 metabolites as measured by the Biocrates metabolomic platform. In a discovery sample of 7,478 individuals of European descent, we find 4,068 genome- and metabolome-wide significant (Z-test, P < 1.09 × 10(-9)) associations between single-nucleotide polymorphisms (SNPs) and metabolites, involving 59 independent SNPs and 85 metabolites. Five of the fifty-nine independent SNPs are new for serum metabolite levels, and were followed-up for replication in an independent sample (N = 1,182). The novel SNPs are located in or near genes encoding metabolite transporter proteins or enzymes (SLC22A16, ARG1, AGPS and ACSL1) that have demonstrated biomedical or pharmaceutical importance. The further characterization of genetic influences on metabolic phenotypes is important for progress in biological and medical research.


Figures
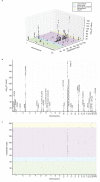
Figure 1
Figure 1
Manhattan plots for all metabolites targeted by the Biocrates AbsoluteIDQ p150 kit (N = [1497, 7478]). These plots graphically display the P values for significant (Z test P < 1.09 × 10⁻⁹) SNP metabolite associations in the discovery phase in the current study. Panel (a) provides a three-dimensional view; orthogonal projections are given in panels (b) and (c). SNPs are arranged according to genomic location along the 'chromosome' axes. The ordering of the metabolites along the 'metabolite index' axes is equal in both panels (a) and (c), and equal to that in Supplementary Table 3. In panels (a) and (b), all data points are displayed semi-transparent and therefore opaque regions in the plot indicate clusters of significant associations. In panel (b), loci are identified by most plausible causal gene or, if no plausible genes found, by nearest gene. Where multiple plausible genes could be identified at the locus (possibly for different metabolites), the gene names are separated by an underscore (“_”) in the locus name. In panel (c), the size of the markers scales linearly with −log10(P value). This Figure is also supplied as a movie (see Supplementary Movie 1).
Figure 2
Figure 2
Associations between loci and metabolites detected in stage 1 meta-analysis in the current study (N = [1588, 7478]). Loci significantly associated with at least one metabolite are depicted as grey circles. Biochemical classes (see Supplementary Table 3) of the metabolites (hexagons) are indicated by node colors: green, acylcarnitines; blue, amino acids; purple, glycerophospholipids; yellow, sphingolipids. Arrows point from each locus to the associated metabolite(s); arrow widths scale linearly with −log10(association P value). Grey arrows denote previously known associations; red arrows denote associations that were newly discovered on the basis of stage 1 meta-analysis in the current study (i.e., either associations with new SNPs for serum metabolite levels, or an association of a known SNPs with a new metabolite with respect to 11 previous GWA studies for serum metabolite levels-). Loci are identified by most plausible causal gene or, if no plausible genes found, by nearest gene. Where multiple plausible genes could be identified at the locus (possibly for different metabolites), the gene names are separated by an underscore (“_”) in the locus name. At this significance threshold (P=1.09 × 10⁻⁹), the locus-metabolite association network separates into 12 connected components or disconnected subnetworks, each including metabolites from maximally two chemical classes. This figure was created using Cytoscape.
Figure 3
Figure 3
Decomposition of variation in serum metabolite levels. This figure displays the proportions of variance in serum metabolite level explained by significantly associated SNPs; heritability not explained by significantly associated SNPs; and unexplained (environmental) variance. Seventy six metabolites are included for which both heritability estimates (monozygotic twin correlations taken from reference13; N = 181 pairs; Pearson correlation) were available, and that displayed genome and metabolome wide associations with SNPs in stage 1 GWA meta-analysis in the current study (N = [1588, 7478]). Proportion of variance explained by significantly associated SNPs was estimated as Pearson’s phi coefficient squared. Metabolites are grouped according to biochemical class.

References

    1. Suhre K, Gieger C. Genetic variation in metabolic phenotypes: study designs and applications. Nat. Rev. Genet. 2012;13:759–769. - PubMed
    1. Suhre K, et al. Human metabolic individuality in biomedical and pharmaceutical research. Nature. 2011;477:54–60. - PMC - PubMed
    1. Nicholson G, et al. A genome-wide metabolic QTL analysis in Europeans implicates two loci shaped by recent positive selection. PLoS Genet. 2011;7:e1002270. - PMC - PubMed
    1. Illig T, et al. A genome-wide perspective of genetic variation in human metabolism. Nat. Genet. 2010;42:137–141. - PMC - PubMed
    1. Gieger C, et al. Genetics meets metabolomics: a genome-wide association study of metabolite profiles in human serum. PLoS Genet. 2008;4:e1000282. - PMC - PubMed

Publication types