. 2015 Jun 11;6(6):e1781.
doi: 10.1038/cddis.2015.148.

1α, 25-Dihydroxyvitamin D₃ and the vitamin D receptor regulates ΔNp63α levels and keratinocyte proliferation

Affiliations

1α, 25-Dihydroxyvitamin D₃ and the vitamin D receptor regulates ΔNp63α levels and keratinocyte proliferation

N T Hill et al. Cell Death Dis. .

Abstract

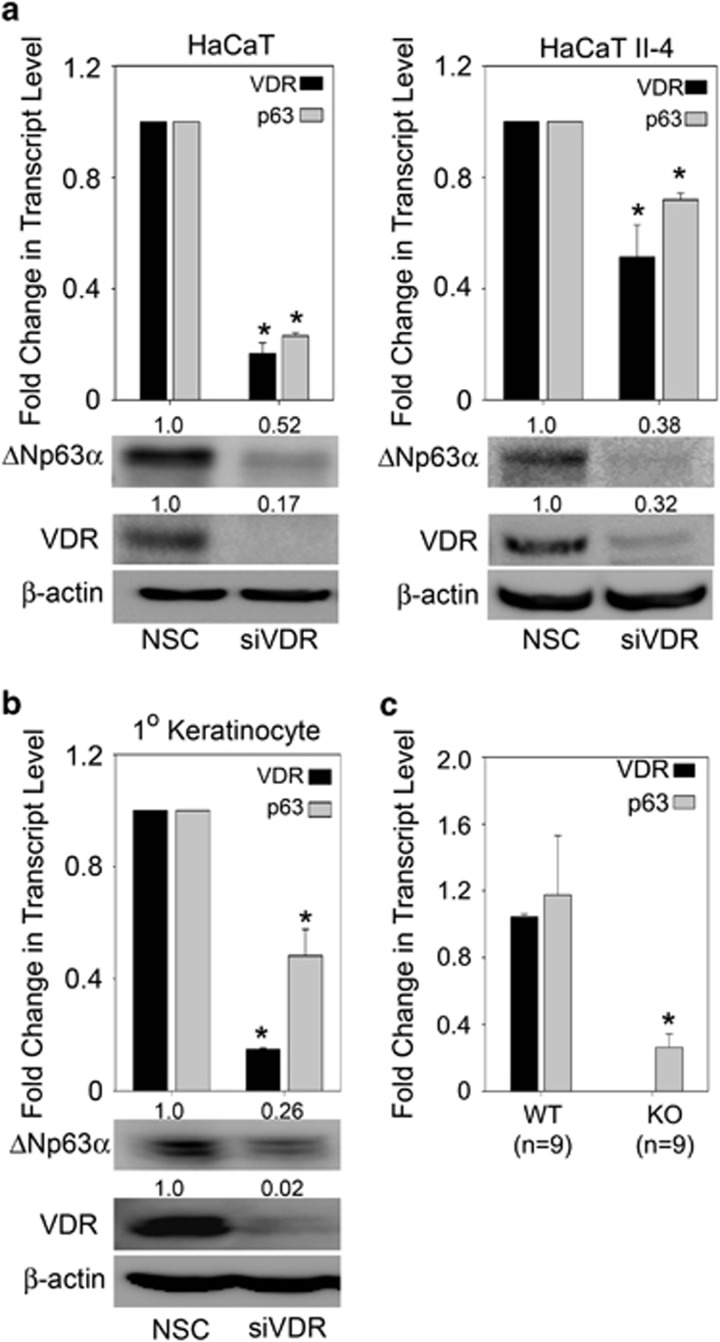
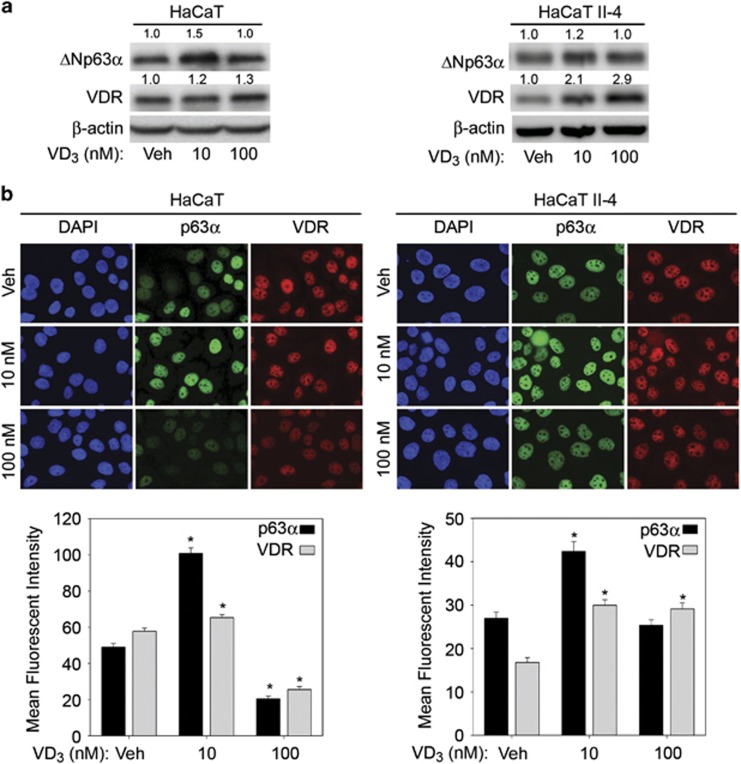
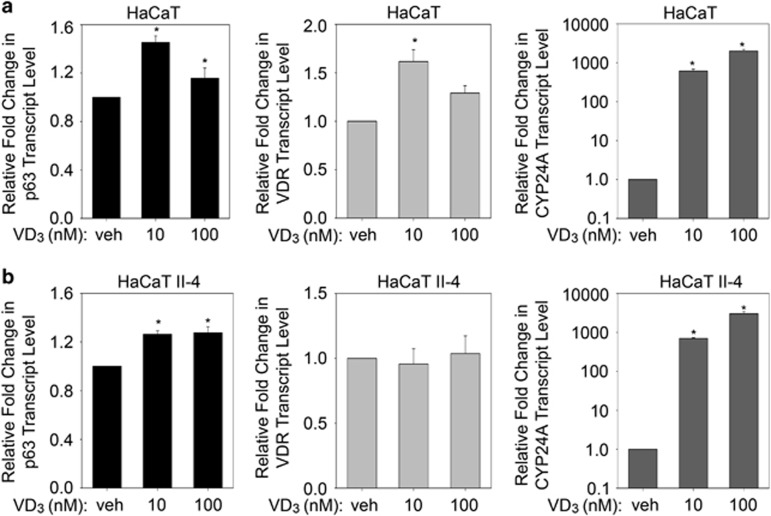
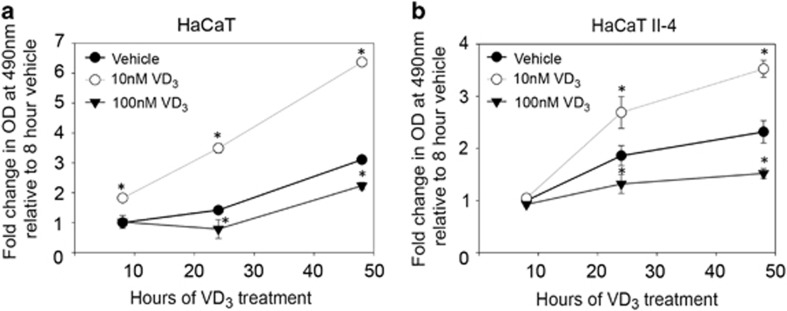
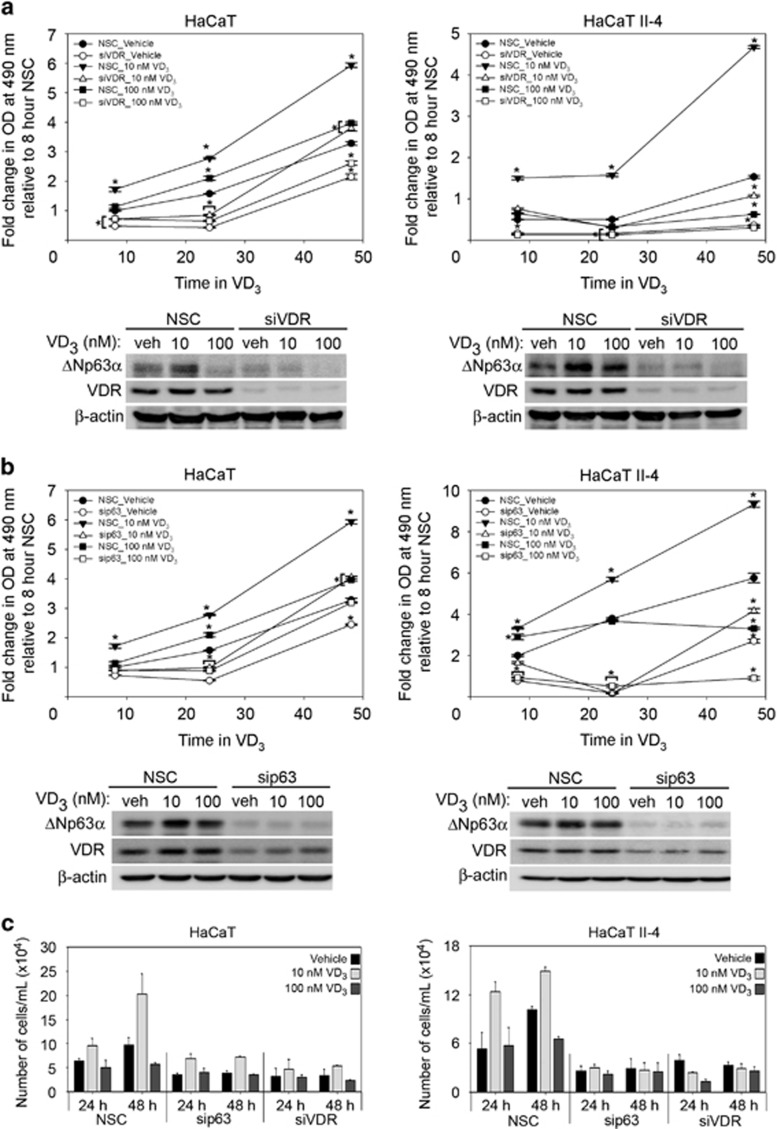
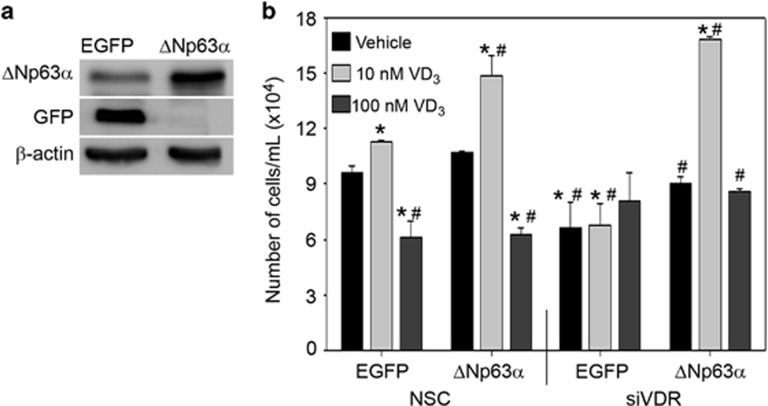
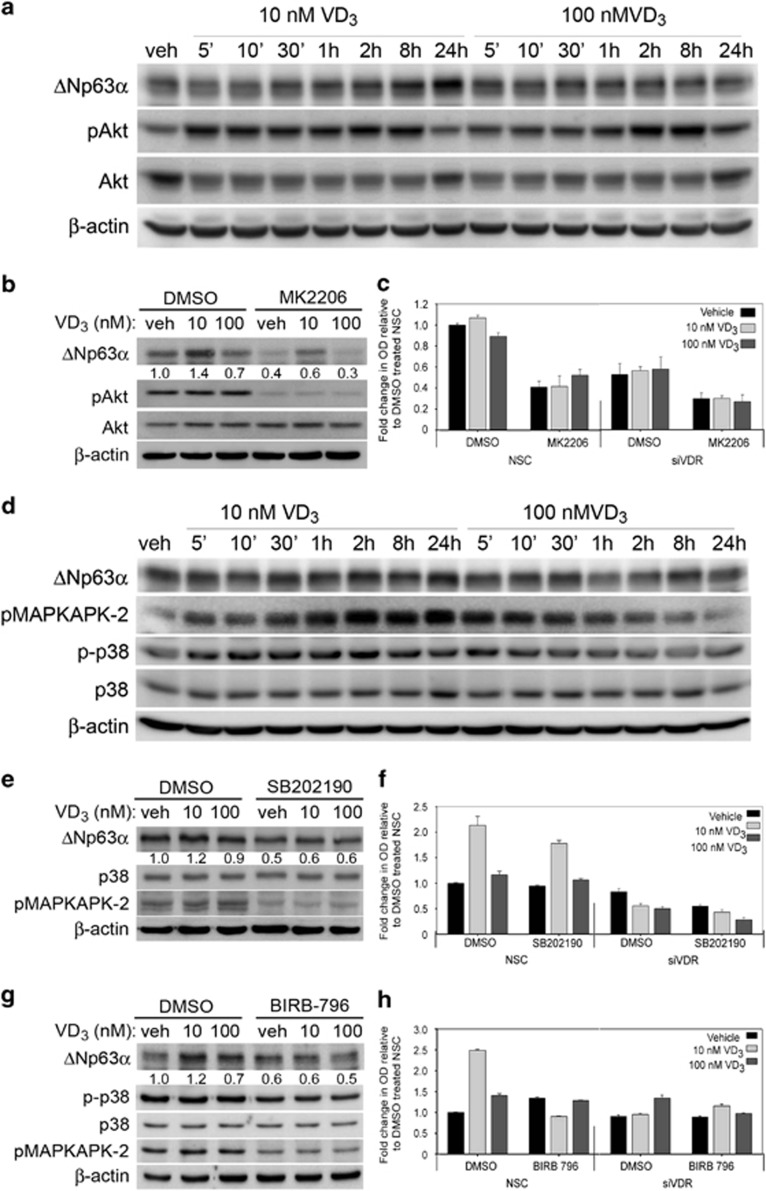
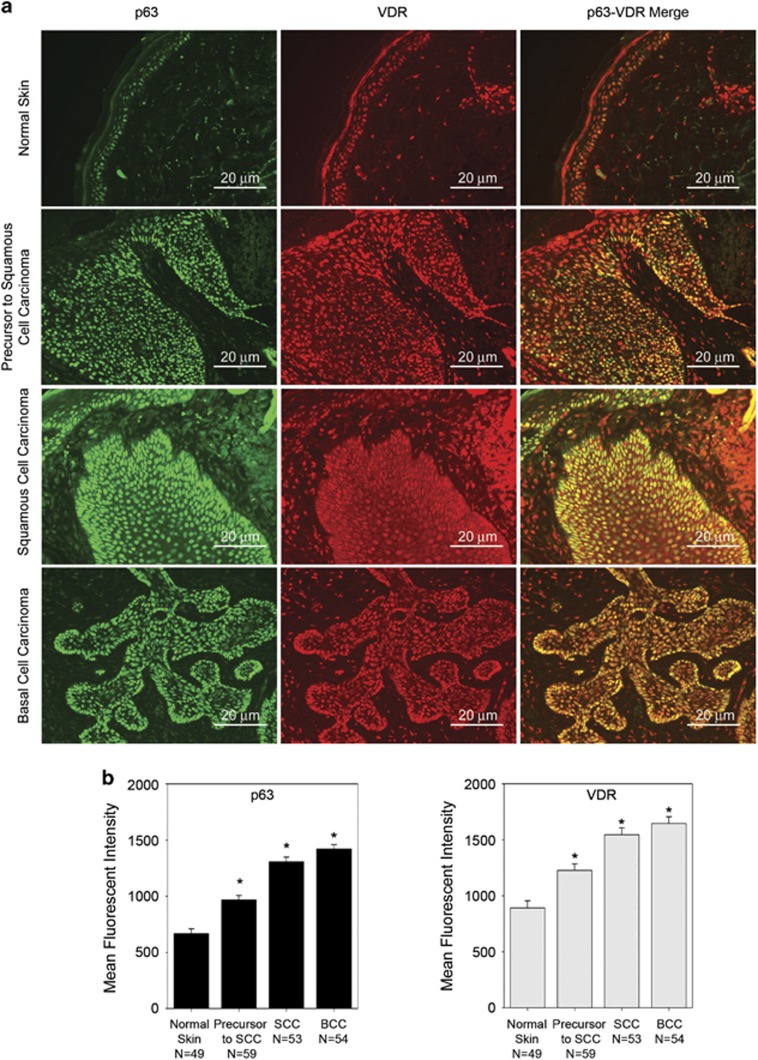
1α, 25-dihydroxyvitamin D3 (VD3), a secosteriod that has been explored as an anti-cancer agent, was also shown to promote cell survival. Its receptor, the Vitamin D Receptor (VDR), is a direct target of the proto-oncogene ΔNp63α, which is overexpressed in non-melanoma skin cancers. The interconnection between VDR/VD3 signaling and ΔNp63α, led us to examine whether VDR/VD3 signaling promotes keratinocyte proliferation by regulating ΔNp63α levels. Our data demonstrate that VDR regulates ΔNp63α expression at both the transcript and protein level. Interestingly, although low doses of VD3 led to an increase in ΔNp63α protein levels and keratinocyte proliferation, high doses of VD3 failed to increase ΔNp63α protein levels and resulted in reduced proliferation. Increased expression of ΔNp63α by low dose VD3 was shown to be dependent on VDR and critical for the proliferative effects of VD3. VD3-mediated increases in ΔNp63α protein levels occur via activation of both p38 MAPK and Akt kinases. Finally, analysis of samples from patients with squamous cell carcinoma (SCC), basal cell carcinoma and precursors to invasive SCC demonstrated a significant correlation between p63 and VDR levels when compared with healthy normal skin control samples. Delineation of the mechanisms by which VD3 exerts its effect on ΔNp63α and cell proliferation is critical for determining the future of VD3 in cancer therapies.


Figures

Figure 1
Figure 1
VDR is essential for basal expression of ΔNp63α. (a) HaCaT (left panel), HaCaT II-4 (right panel) and (b) neonatal human epidermal keratinocyte cells were transfected with non-silencing control (NSC) or siRNA against VDR. The change in mRNA levels and protein expression of p63 and VDR were measured by qRT-PCR (*P values≤0.05) and immunoblot analyses, respectively. (c) The change in transcript levels of p63 and VDR were measured by qRT-PCR in total RNA extracted from skin of wild-type or VDR knockout (KO) mice. *P values≤0.05
Figure 2
Figure 2
VD3 dosage differentially affects ΔNp63α. (a) HaCaT and HaCaT II-4 cells were treated with vehicle, 10 nM VD3 or 100 nM VD3 for 24 h, and then subjected to immunoblot analysis for ΔNp63α, VDR and β-actin. The fold change in protein levels, relative to vehicle-treated cells, is listed above each band. (b) Top panel: HaCaT and HaCaT II-4 were treated with vehicle, 10 nM VD3 or 100 nM VD3 overnight followed by detection of p63α and VDR by immunofluorescence. Bottom panel: average mean fluorescent intensity of immunofluorescence staining for p63α and VDR in HaCaT and HaCaT II-4. Error bars represent standard error of the mean. *P values≤0.05 compared with vehicle control cells
Figure 3
Figure 3
VD3 increases ΔNp63α transcript levels. (a) HaCaT and (b) HaCaT II-4 cells were treated with vehicle, 10 nM VD3 or 100 nM VD3 for 24 h. Transcript levels of p63 (left panel), VDR (middle panel) and CYP24A (right panel) were analyzed by TaqMan-based qRT-PCR (*P values≤0.05)
Figure 4
Figure 4
VD3 dosage differentially affects cell proliferation. HaCaT (a) and HaCaT II-4 (b) cells were treated with vehicle, 10 nM VD3 or 100 nM VD3 for 8, 24 and 48 h, and cell proliferation was measured by MTS cell titer assay. Y axis represents fold change when compared with vehicle-treated cells. Error bars represent standard deviation from the mean. *P values≤0.05 compared with vehicle control cells
Figure 5
Figure 5
VDR and ΔNp63α are required for VD3-mediated cell proliferation. HaCaT and HaCaT II-4 cells were transfected with non-silencing control (NSC) or siVDR (panel a) or sip63 (panel b) followed by treatment with vehicle control, 10 nM or 100 nM VD3 for 8, 24 and 48 h as indicated. Cell proliferation was measured by MTS cell titer assay. Y axis represents fold change when compared with NSC transfected vehicle-treated cells. Confirmation of silencing was measured by western blot following VD3 treatment (lower panels). (c) HaCaT and HaCaT II-4 cells were transfected with siRNA against p63 or VDR followed by treatment with vehicle control or VD3 at 10 nM or 100 nM for 24 and 48 h. Cell viability was measured by trypan blue cell exclusion. Error bars represent standard deviation from the mean. *P values≤0.05 for knockdown condition that is significantly different from vehicle-treated NSC
Figure 6
Figure 6
ΔNp63α rescues reduction in VD3-mediated cell proliferation following loss of VDR. (a) The expression of eGFP and ΔNp63α were confirmed in HaCaT-eGFP and HaCaT-ΔNp63α stable cells via immunoblot analysis. (b) HaCaT-eGFP and HaCaT-ΔNp63α stable pools were transfected with non-silencing control (NSC) or siVDR followed by treatment with vehicle control, 10 nM or 100 nM VD3 for 24 h. Cell viability was measured following VD3 treatment by trypan blue cell exclusion. Error bars represent standard deviation from the mean. *P values≤0.05 compared with vehicle control EGFP expressing HaCaT cells. #P values≤0.05 compared with 10 nM EGFP expressing HaCaT cells
Figure 7
Figure 7
VD3 regulates ΔNp63α levels via p38 and Akt activation. (a) HaCaT cells were treated with VD3 and harvested at different time points as indicated. Whole-cell lysates were subjected to immunoblot analysis for p63, pAkt, Akt and β-actin. (b) HaCaT cells were pretreated with 10 μM MK2206 or DMSO control for 1 h followed by treatment with either vehicle, 10 nM VD3 or 100 nM VD3 for 24 h. Whole-cell lysates were subjected to immunoblot analysis for the indicated proteins. The fold change in protein levels for ΔNp63α, relative to vehicle-treated cells, as described in materials and methods is listed below each band. (c) HaCaT cells were transfected with non-silencing control (NSC) or siRNA against VDR. Cells were incubated for 1 h in media containing 10 μM MK2206 or DMSO control prior to treatment with the indicated doses of VD3 or vehicle for 24 h and MK2206 or DMSO. Cell proliferation was measured 24 h post VD3 treatment by MTS assay. (d) HaCaT cells were treated with VD3 and harvested at different time points as indicated. Whole-cell lysates were subjected to immunoblot analysis for p-p38, p63, pMAPKAPK-2, p38 and β-actin. (e and g) HaCaT cells were pretreated with 15 μM SB202190 or DMSO control for 1 h (e) or pretreated with 1 μM BIRB-796 or DMSO control for 2 h (g) followed by treatment with either vehicle, 10 nM VD3 or 100 nM VD3 for 24 h. Whole-cell lysates were subjected to immunoblot analysis for the indicated proteins. The fold change in protein levels for ΔNp63α, relative to vehicle-treated cells, are listed below each band. (f and h) HaCaT cells were transfected with NSC or siRNA against VDR. Cells were pretreated with 15 μM SB202190 or DMSO control for 1 h (f) or pretreated with 1 μM BIRB-796 or DMSO control for 2 h (h) prior to replacing media with fresh SB202190 or BIRB-796 and either vehicle, 10 nM VD3 or 100 nM VD3 for 24 h. Cell proliferation was measured 24 h post VD3 treatment by MTS assay
Figure 8
Figure 8
VDR and p63 expression are increased in NMSC. (a) Top panels show representative images taken at a × 20 magnification of normal skin, precursors to SCC, SCC and BCC from formalin fixed, paraffin-embedded human skin stained for p63 and VDR (scale bar=20 μm). (b) Quantitation of p63 and VDR levels from 49 normal skin samples, 59 precursors to SCC samples, 53 SCC samples and 54 BCC samples are plotted. Y axis represents the mean fluorescent intensity, normalized to background, in arbitrary units. Error bars represent standard error. *P≤0.05 compared with normal skin

References

    1. Jin CH, Kerner SA, Hong MH, Pike JW. Transcriptional activation and dimerization functions in the human vitamin D receptor. Mol Endocrinol 1996; 10: 945–957. - PubMed
    1. Haussler MR, Norman AW. Chromosomal receptor for a vitamin D metabolite. Proc Natl Acad Sci USA 1969; 62: 155–162. - PMC - PubMed
    1. Silvagno F, Consiglio M, Foglizzo V, Destefanis M, Pescarmona G. Mitochondrial translocation of vitamin D receptor is mediated by the permeability transition pore in human keratinocyte cell line. PLoS One 2013; 8: e54716. - PMC - PubMed
    1. Asagami C, Muto M, Hirota T, Shimizu T, Hamamoto Y. Anti-tumor effects of 1,25-dihydroxyvitamin D3 (1,25(OH)2D3) in seborrheic keratosis. J Investig Dermatol Symp Proc 1996; 1: 94–96. - PubMed
    1. Deeb KK, Trump DL, Johnson CS. Vitamin D signalling pathways in cancer: potential for anticancer therapeutics. Nat Rev Cancer 2007; 7: 684–700. - PubMed

Publication types

MeSH terms

LinkOut - more resources