. 2015 Jun 11:5:10317.
doi: 10.1038/srep10317.

A posteriori correction of camera characteristics from large image data sets

Affiliations

A posteriori correction of camera characteristics from large image data sets

Pavel Afanasyev et al. Sci Rep. .

Abstract

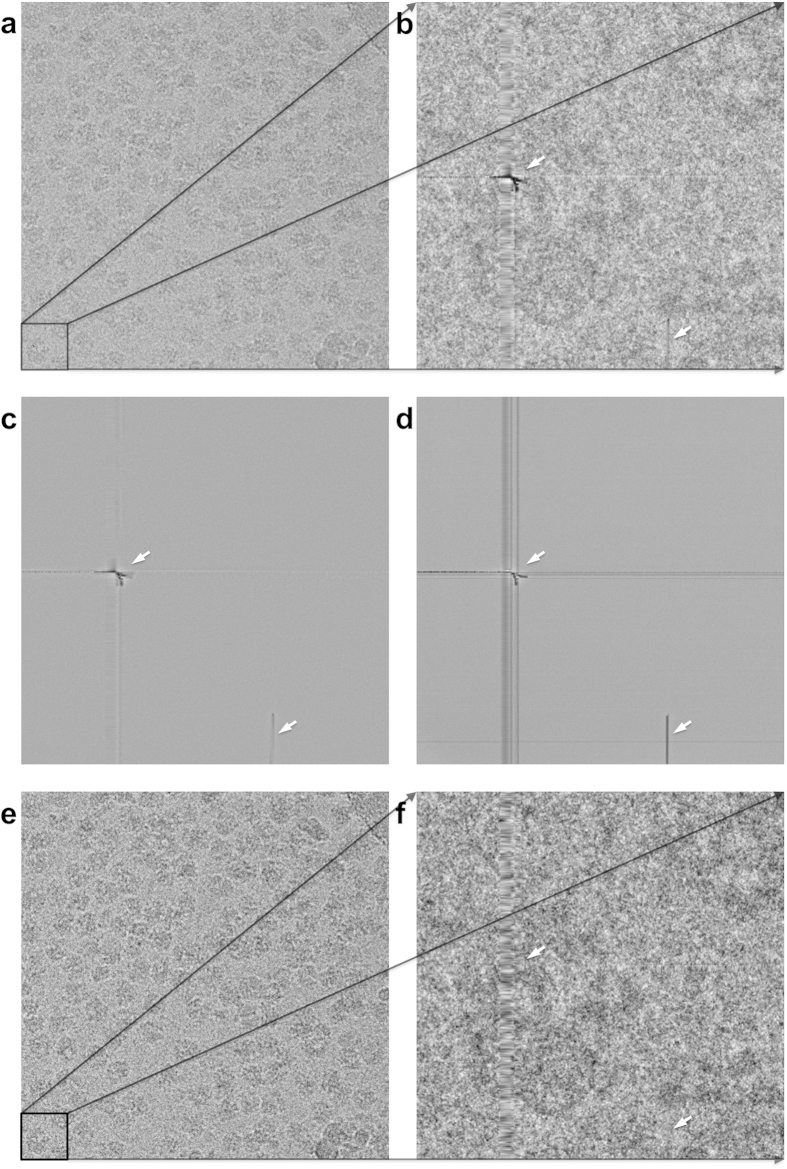
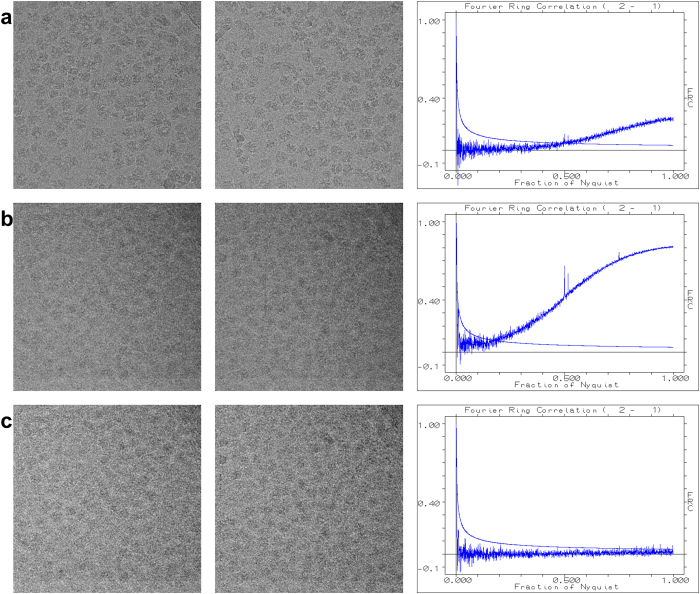
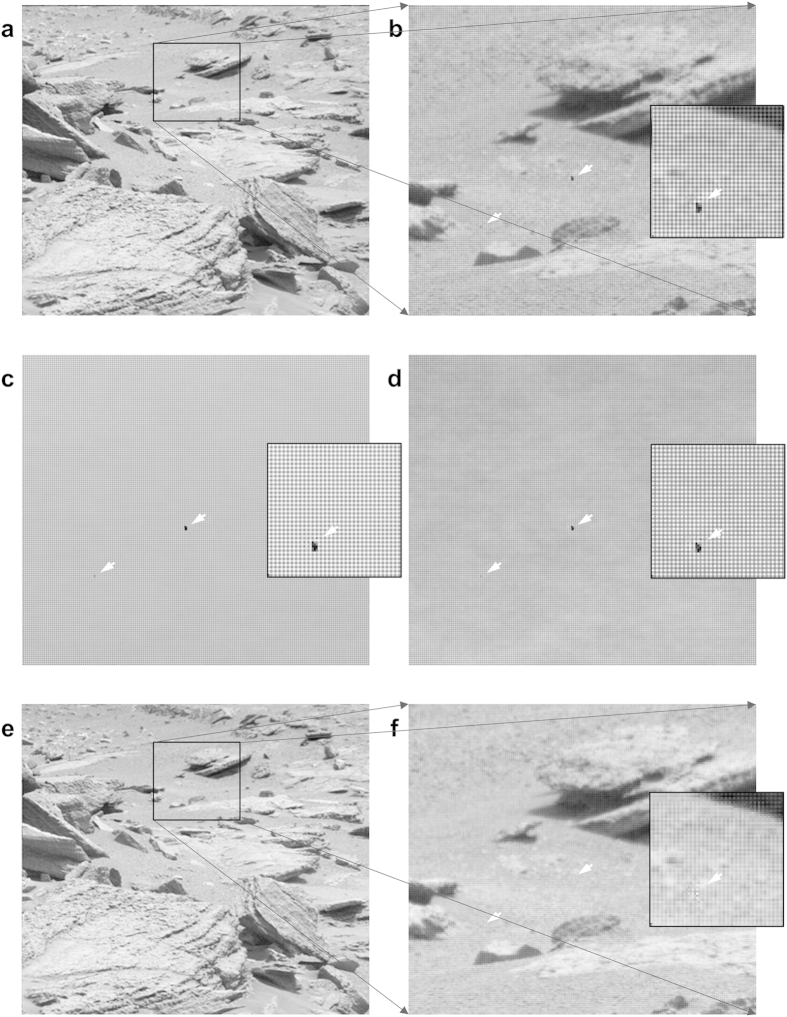
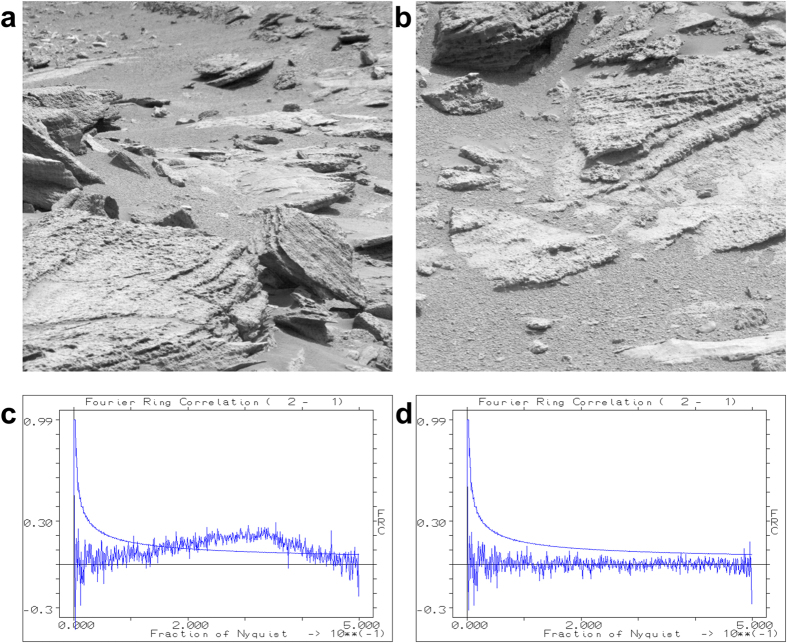
Large datasets are emerging in many fields of image processing including: electron microscopy, light microscopy, medical X-ray imaging, astronomy, etc. Novel computer-controlled instrumentation facilitates the collection of very large datasets containing thousands of individual digital images. In single-particle cryogenic electron microscopy ("cryo-EM"), for example, large datasets are required for achieving quasi-atomic resolution structures of biological complexes. Based on the collected data alone, large datasets allow us to precisely determine the statistical properties of the imaging sensor on a pixel-by-pixel basis, independent of any "a priori" normalization routinely applied to the raw image data during collection ("flat field correction"). Our straightforward "a posteriori" correction yields clean linear images as can be verified by Fourier Ring Correlation (FRC), illustrating the statistical independence of the corrected images over all spatial frequencies. The image sensor characteristics can also be measured continuously and used for correcting upcoming images.


Figures

Figure 1
Figure 1
One full raw 4096 × 4096 ribosome image (a), and one specific zoomed-in 512 × 512 patch (lower-left corner) extracted from that image (b). This patch was the worst patch we could find in this experimental 4096 × 4096 back-thinned CMOS direct electron detection camera. The chip errors are such that they can be visually pinpointed in the image in spite of the a priori correction of the data. The average of all corresponding patch images from the full dataset – a total of 10821 images - is shown in frame (c). Spurious vertical and horizontal lines and other serious “fixed pattern” defects become clearly visible, while the ribosome images disappear altogether due to the averaging. The corresponding patch in the σ-image (d) reveals a strong bundle of about 16 vertical lines (marked by the left arrow) that were well suppressed by the standard a priori correction. While this suppression apparently included the averaging of pixel information in the immediate vicinity of these “dead” pixels and lines, the sensitivity of these chip areas collapses as is revealed by the dark areas in the σ-image. Moreover, the σ-image also reveals a thin horizontal line at the bottom of the patch (lower arrow) that had been corrected out in the average image (c), but again without compensating for the gain anomalies generated by the defect. The a posteriori corrected images are shown in panels (e) and (f) derived from the images shown in panels (a) and (b), respectively. Interestingly the a posteriori correction managed to improve on the dataset even by visual criteria although the more relevant metric is the FRC (see Fig. 2). The amplitude spectra of the average and standard-deviation images are shown in the Supplementary Fig. S1.
Figure 2
Figure 2
(a) Two different images collected on the same sensor (dataset of Fig. 1) can show a strong correlation of the fine image details (high frequency Fourier space components) due to a common background pattern in the image transducer. The FRC curve shows that the high-frequency information fully exceeds (by more than 3σ) the level of expected random-noise correlations. (b) This effect can be exaggerated if we first average a number of raw input images to yield two image averages (12 different images per average are used here) and only then to perform the FRC calculations between these two average images. The extra peaks at 0.5 and 0.75 of the Nyquist frequency in the FRC curve, are associated with fixed sensor readout patterns of the on-chip electronics. (c) The FRC of the same averaged image-sets illustrates that after the a posteriori correction the systematic background pattern is virtually removed from the data. Note that, in this 12-fold exaggerated critical test, the correction of the residual sensor pattern is close-to perfect.
Figure 3
Figure 3
In (a) a single 1344 × 1200 pixel image, from the “Mastcam right” camera (MSSS-MALIN) of the NASA Mars rover Curiosity, is shown together with a 300 × 336 pixel detail (b). We used 1064 raw images of 1344 × 1200 pixels from this camera (http://mars.jpl.nasa.gov/msl/multimedia/raw/) to find the average image (see 300 × 336 detail (c); the central part of that is shown as an extra inset) and the σ-image image (300 × 336 detail: (d)). Apart from the strong visibility of the Bayer pattern in the average image of this camera, a block of 3 × 5 pixels with a very poor response is marked by a white arrow in the various “detail” images. A smaller anomaly visible in both the average - and the standard deviation image is marked by another white arrow. The a posteriori corrected image is shown in panel (e) and in detail in (f). The Bayer pattern is now largely invisible as are the other marked anomalies. The improvement of Fourier Ring Correlation between different images of this dataset by the a posteriori correction is discussed in Fig. 4.
Figure 4
Figure 4
Fourier Ring Correlation (FRC) of two Mars rover images. Two typical images (a and b) taken from the Mastcam-right camera dataset (Fig. 3) are compared to each other by cross-correlation as function of spatial frequency (the central 1200 × 1200 pixels part of the images were used). The FRC of the raw uncorrected images (c) shows significant correlations (above 3σ of the theoretically expected value for random noise correlations) at around the 0.5 Nyquist frequency range, associated with the repeat of the 2 × 2 pixel Bayer pattern of the sensor. After a posteriori correction, the FRC oscillates around the zero value up to the Nyquist frequency (d).

References

    1. Boyle W. S. & Smith G. E. Charge coupled semiconductor devices. At & T Tech. J. 49, 587 -+ (1970).
    1. Aikens R. S., Agard D. A. & Sedat J. W. Solid-state imagers for microscopy. Method Cell Biol. 29, 291–313 (1989). - PubMed
    1. Yu X., Jin L. & Zhou Z. H. 3.88 A structure of cytoplasmic polyhedrosis virus by cryo-electron microscopy. Nature 453, 415–419 (2008). - PMC - PubMed
    1. Campbell M. G. et al. Movies of ice-embedded particles enhance resolution in electron cryo-microscopy. Structure 20, 1823–1828 (2012). - PMC - PubMed
    1. Li X. et al. Electron counting and beam-induced motion correction enable near-atomic-resolution single-particle cryo-EM. Nature Meth. 10, 584–590 (2013). - PMC - PubMed