

Chromatin signatures at Notch-regulated enhancers reveal large-scale changes in H3K56ac upon activation
- PMID: 26069324
- PMCID: PMC4547894
- DOI: 10.15252/embj.201489923
Chromatin signatures at Notch-regulated enhancers reveal large-scale changes in H3K56ac upon activation
Abstract
The conserved Notch pathway functions in diverse developmental and disease-related processes, requiring mechanisms to ensure appropriate target selection and gene activation in each context. To investigate the influence of chromatin organisation and dynamics on the response to Notch signalling, we partitioned Drosophila chromatin using histone modifications and established the preferred chromatin conditions for binding of Su(H), the Notch pathway transcription factor. By manipulating activity of a co-operating factor, Lozenge/Runx, we showed that it can help facilitate these conditions. While many histone modifications were unchanged by Su(H) binding or Notch activation, we detected rapid changes in acetylation of H3K56 at Notch-regulated enhancers. This modification extended over large regions, required the histone acetyl-transferase CBP and was independent of transcription. Such rapid changes in H3K56 acetylation appear to be a conserved indicator of enhancer activation as they also occurred at the mammalian Notch-regulated Hey1 gene and at Drosophila ecdysone-regulated genes. This intriguing example of a core histone modification increasing over short timescales may therefore underpin changes in chromatin accessibility needed to promote transcription following signalling activation.
Keywords: CBP/Nejire; CSL; H3K56ac; Notch; chromatin state.
© 2015 The Authors.
Figures

A E(spl)-C along with the histone modification data used to generate the chromatin signatures, where enrichment is shaded brown (highly enriched) to blue (depleted). Su(H) binding profile for BG3 cells (brown graph: fold enrichment, Log2 scale is −1.2 to 3.89, and blue shading indicates significant peaks 1% FDR) aligned with the chromatin map colour coded as in (B). Gene models are depicted in blue.
B Summary of the 11 chromatin signatures derived from Hidden Markov model, showing enrichments for a subset of histone modifications, brown (highly enriched) to blue (depleted) (see Supplementary Fig S1 for full profiles and comparisons).
C Numbers and extent of overlap in Su(H)-occupied regions between Kc and BG3 cells, the Su(H) motif was highly enriched in both data sets (P-values 4.2 × 10⁻¹⁰ and 2.12 × 10⁻¹⁴).
D, E Distribution of Su(H)-bound regions according to chromatin type in BG3 (D) and Kc (E) cells; chromatin is colour coded according to the scheme in (B) and Supplementary Fig S1A. Grey bars indicate the proportion of the genome in each chromatin signature.

High-affinity motifs used in the analysis and numbers occupied by Su(H) in each cell type as indicated.
Distribution of bound and unbound motifs according to chromatin type. Colour code indicates chromatin type, and the number of motifs in each state are indicated.
Examples where Su(H) binding is concordant with chromatin. Each panel depicts a gene region with the chromatin map (colours as in Fig1B), Su(H) binding profiles for each cell type (fold enrichment Log2 with ranges −1.2 to 3.89 for BG3 and −0.86 to 2.09 for Kc167; significant 1% FDR peaks are shaded in blue) and positions of Su(H) motifs indicated. Gene models are depicted beneath each plot.
Graph summarising the relationship between binding and chromatin in the two cell types. Brown bars, loci bound in both cell types; chromatin environment of bound motifs in Kc cells that were bound in Enh chromatin in BG3 cells. 100% are in Enh chromatin in both cell types. Green bars, motifs bound in Kc but not in BG3; chromatin environment of unbound motifs in BG3 cells that were bound in Enh chromatin in Kc cells. Blue bars, motifs bound in BG3 but not in Kc; chromatin environment of unbound motifs in Kc cells that were bound in Enh chromatin in BG3 cells. Some unbound motifs in each cell type are in less favourable chromatin but many remain in Enh even though not detectably bound.
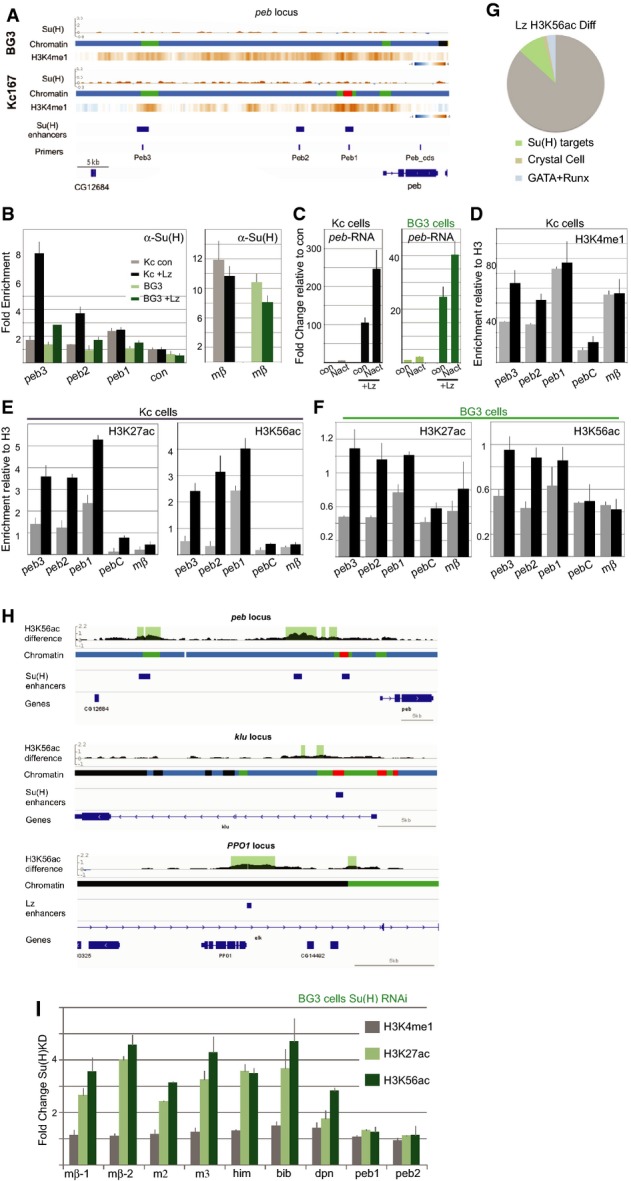
A peb region with chromatin maps, Su(H) binding profiles and H3K4me1 heat maps for each cell type, and the known Su(H)/Notch-regulated peb enhancers are indicated, along with primers used.
B Fold change in RNA levels in Kc and BG3 cells in the presence of Lz compared to control conditions (con: empty pMT) and to cells with Notch activation (Nact). Lz expression was induced for 3 days prior to the experiment, and RNA was analysed 30 min after exposing cells to control conditions or to EGTA to elicit Notch activation.
C Bound Su(H) was captured by ChIP from Kc (grey/black) and BG3 (light/dark green) cells, with (black, dark green) or without (grey, light green) ectopic Lz, and the levels of the indicated enhancers analysed. Binding was significantly enriched at peb3 in BG3 and Kc cells and at peb2 in Kc cells (P < 0.05).
D–F Enrichment of the indicated histone modifications detected by ChIP in Kc (D, E) and BG3 cells (F); control cells (grey; empty pMT), with ectopic Lz (black). peb regions analysed correspond to those depicted in (A) (primers), and enrichment was calculated relative to total H3. Changes in the modifications at peb3 and peb2 were significant in all cases (P < 0.05).
G, H Differences in the profile of H3H56ac upon expression of Lz. (G) Percentage of regions with significant differences located in proximity to 224 Notch-/Su(H)-regulated genes (green, P = 1.6 × 10⁻¹⁸; Krejcí et al, 2009), to 31 known crystal cell-expressed genes (brown, P = 0.00057; Ferjoux et al, 2007) and to 269 genes with defined GATA-RUNX motif (blue, P = 0.0019; Ferjoux et al, 2007). (H) Regions with significant differences detected at Notch-regulated enhancers in peb and klu and at the Lz-regulated enhancer in PPO1 (Ferjoux et al, 2007). Gene regions with chromatin maps showing difference in H3K56ac, regions where the difference is significant (1% FDR) are shaded.
I Fold change in enrichment of the indicated histone modifications at enhancers following RNAi treatment to deplete Su(H) compared to control (GFP RNAi). Increase in H3K27ac and H3K56ac occur at mβ-1, mβ-2, m2, m3, him, bib and dpn, which are bound by Su(H) in BG3 cells but not at peb2, peb3 which are not bound by Su(H) in BG3 cells.

AVenn diagram summarising the relationship between Su(H)-bound regions in control and Notch-activated (EGTA-treated for 30 mins) cells.
B Distribution of de novo Su(H) peaks, detectable only in activated cells, according to chromatin state.
C, D Representative experiment comparing the enrichment of the indicated histone modifications at several loci in control and Notch-activated (30 min) cells. Details of loci analysed are provided in the Supplementary Information.
E Changes in enrichment of the indicated modifications at selected loci 30 min after Notch activation compared to control-treated cells.
F Treatment with a γ-secretase inhibitor (GSI: 10 nM Compound E) prevents the increase in mRNA levels in Notch-activated cells.
G Treatment with a γ-secretase inhibitor (GSI: 10 nM Compound E, conditions as in F) prevents the increase in H3K56ac in Notch-activated cells.


Him-Her gene region showing that Notch activity induces changes in H3K56ac in BG3 cells but not in Kc Cells. Graphs and details as in Fig5A. Nact chromatin shows the results from running the HMM using the data from the Notch-activated BG3 cells, and the Su(H)-bound region has gained an Enh (red) signature.
Fold change in expression of intergenic RNAs at E(spl) locus after Notch treatment (30 mins EGTA) in the presence and absence of the indicated inhibitors. Upper panel summarises the primers used to detect non-coding RNAs and their relationship to Su(H) binding profile (plotted as in Fig5). Graphs summarise the expression of intergenic RNAs and coding RNAs under the conditions indicated.
Effects of indicated inhibitors (see Supplementary Table S2) on E(spl)mβ-HLH and E(spl)m3-HLH RNA levels following Notch activation. RNA levels from untreated (-) and Notch-activated (+; EGTA-treated) cells were normalised to rp49.
Effects of the indicated inhibitors (see Supplementary Table S2) on the fold change in H3K56ac in Nact cells compared to control, measured by the enrichment for the indicated loci in anti-H3K56ac ChIP.
Hey1 locus in mouse cells with previously documented CSL/RBPJ and p300 profiles (Castel et al, 2013) and positions of primers used in (D).
Enrichment for H3K56ac at the indicated positions relative to control region (Hey1-L4; Kr9/14-con) in control cells (grey; exposed to Fc and DAPT) or in Notch-activated cells, (blue: exposed to Fc-DLL1) after 2.5 h (light shading) or 6 h (dark shading).

Eip78C and DlpB-pri/tal gene regions showing chromatin maps and H3K56ac in un-stimulated cells, along with positions of primers used in (B). Ecdysone-responsive enhancers for DlpB-pri/tal are those identified in S2 cells (Shlyueva et al, 2014), EcR DamID peaks, regions bound by EcR in Kc cells (Gauhar et al, ; Chanut-Delalande et al, 2014).
Fold change in H3K56ac at the indicated regions following 1-h (grey) or 3-h (black) treatment with 20-hydroxy-ecdysone.
Fold change in H3K56ac across Hr4, under the same conditions as in (B) (see Supplementary Methods for primers).
Fold change in RNA levels for the indicated loci following 20-hydroxy-ecdysone treatment as in (B).
References
-
- Bowers EM, Yan G, Mukherjee C, Orry A, Wang L, Holbert MA, Crump NT, Hazzalin CA, Liszczak G, Yuan H, Larocca C, Saldanha SA, Abagyan R, Sun Y, Meyers DJ, Marmorstein R, Mahadevan LC, Alani RM, Cole PA. Virtual ligand screening of the p300/CBP histone acetyltransferase: identification of a selective small molecule inhibitor. Chem Biol. 2010;17:471–482. - PMC - PubMed
-
- Bray SJ. Notch signalling: a simple pathway becomes complex. Nat Rev Mol Cell Biol. 2006;7:678–689. - PubMed
-
- Bray S, Bernard F. Notch targets and their regulation. Curr Top Dev Biol. 2010;92:253–275. - PubMed
Publication types
MeSH terms
Substances
Associated data
- Actions
Grants and funding
LinkOut - more resources
Full Text Sources
Other Literature Sources
Molecular Biology Databases
