. 2010 Jan;1(1):20-8.
doi: 10.1177/1947603509355970.

The Maturation of Synthetic Scaffolds for Osteochondral Donor Sites of the Knee: An MRI and T2-Mapping Analysis

Affiliations

The Maturation of Synthetic Scaffolds for Osteochondral Donor Sites of the Knee: An MRI and T2-Mapping Analysis

Asheesh Bedi et al. Cartilage. 2010 Jan.

Abstract

Objective: The purpose of this study was to analyze the morphological imaging characteristics and incorporation of TruFit bone graft substitute (BGS) plugs using cartilage-sensitive magnetic resonance imaging (MRI) and quantitative T2 mapping.

Design: Twenty-six patients (mean age, 28.72 years; range, 11-56 years) underwent osteochondral autologous transplantation (OATS) for chondral defects with filling of the knee joint donor sites using Trufit BGS plugs. The mean follow-up interval between implantation and MRI analysis was 21.3 months (range, 6-39 months). During this period, 43 cartilage-sensitive and 25 quantitative T2-mapping MRI studies were performed. The donor sites were assessed for plug and interface morphology, displacement, hypertrophy, subchondral edema, presence of bony overgrowth, percentage fill, and degree of incorporation. T2 relaxation times were measured for the superficial and deep layers of the repair tissue. A linear regression and correlational analysis was performed with Bonferroni correction, and P < 0.05 was defined as significant.

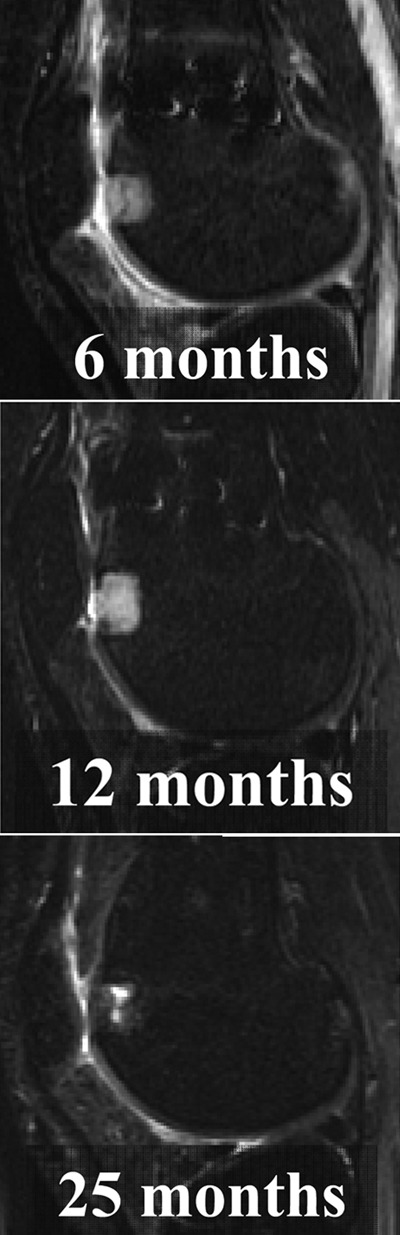
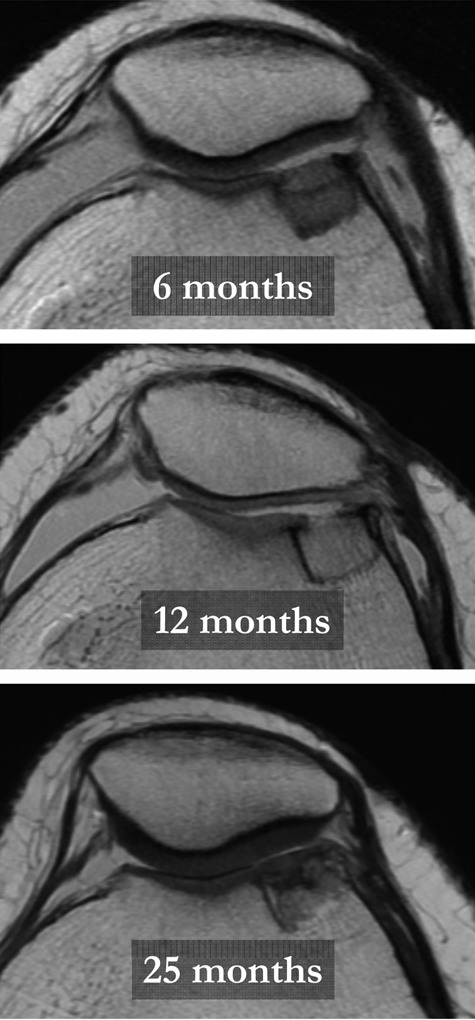
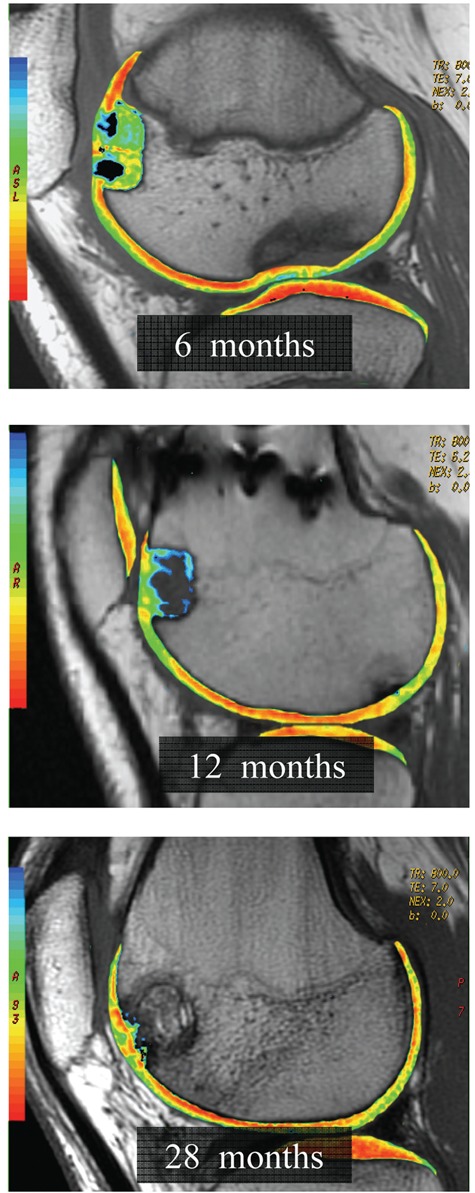
Results: Longitudinal analysis revealed favorable plug appearance at early follow-up (≤6 months), with 75% of plugs demonstrating flush morphology and 78% demonstrating near complete to complete fill. Plug appearance deteriorated at intermediate follow-up (~12 months), with only 26% of plugs demonstrating flush morphology and 52% with near complete or complete fill. Plug appearance substantially improved with longer follow-up (≥16 months), with 70% of plugs demonstrating flush morphology and 90% demonstrating near complete or complete fill. Interface resorption was common at ~12 months (P < 0.0001) and was associated with older age (P = 0.01) or a single-plug configuration (P = 0.04). T2 values for the repair cartilage approached that of normal cartilage with increasing duration after surgery (P < 0.004), more so for single- compared with multiple-plug configurations (P = 0.03).

Conclusions: The Trufit BGS plug demonstrates a predictable pattern of postoperative maturation on MRI images that parallels its biological incorporation. An intermediate postoperative interval can be associated with unfavorable MRI findings. However, the plug appearance significantly improves with greater postoperative duration and has mean T2 relaxation times that approach those of normal articular cartilage.

Keywords: TruFit plug; cartilage; donor lesion; synthetic scaffold.


Conflict of interest statement

Declaration of Conflicting Interests: The authors declared no potential conflicts of interests with respect to the authorship and/or publication of this article.

Figures

Figure 1.
Figure 1.
Sagittal fat-suppressed cartilage-sensitive, fast-spin echo magnetic resonance images of a TruFit bone graft substitute plug at 6 months, 12 months, and 25 months postoperatively demonstrates absence of adjacent bone marrow edema pattern, at even 6 months postoperatively. Images also demonstrate no displacement, effusion, or an adverse synovial reaction.
Figure 2.
Figure 2.
Axial cartilage-sensitive, fast-spin echo magnetic resonance images of a TruFit bone graft substitute plug at 6 months, 12 months, and 25 months postoperatively. Plugs demonstrate a favorable appearance in the early postoperative period, with greater than 75% of plugs demonstrating a flush morphology and near complete or complete fill of the defect. Plug appearance deteriorates by approximately 12 months postoperatively. Only 26% of plugs demonstrated a flush morphology, and only 52% of plugs exhibited near complete or complete fill of the defect. Plug appearance substantially improves, however, with longer postoperative duration (≥16 months). Seventy percent of plugs (32 of 46) demonstrated flush morphology, and 90% of plugs (40 and 46) exhibited near complete or complete fill.
Figure 3.
Figure 3.
Sagittal cartilage-sensitive, fast-spin magnetic resonance images of 4 TruFit bone graft substitute plugs used to fill donor defects at 11 months and 24 months postoperatively. Mild bony overgrowth was observed and strongly correlated with a middle position in a multiple-plug configuration (P < 0.0001) and with postoperative duration greater than 16 months (P < 0.0001).
Figure 4.
Figure 4.
Sagittal cartilage-sensitive, fast-spin echo magnetic resonance images of a TruFit bone graft substitute plug (BGS) at 6 months, 12 months, and 38 months postoperatively. The appearance of the plug parallels its biological incorporation, demonstrating unfavorable characteristics during the phase of resorption and early incorporation at intermediate postoperative follow-up. Resorption at the plug-native bone interface was seen in greater than 60% of TruFit BGS plugs at approximately 12 months.
Figure 5.
Figure 5.
Sagittal cartilage-sensitive, fast-spin echo magnetic resonance images of a TruFit bone graft substitute plug at 4 months, 12 months, and 39 months postoperatively. Complete incorporation of the plug into host bone was observed in greater than 60% of cases at final follow-up (≥16 months).
Figure 6.
Figure 6.
Sagittal quantitative T2-mapping of a TruFit bone graft substitute plug used to fill a donor void at 6 months, 12 months, and 28 months postoperatively. T2 relaxation times (milliseconds) for the superficial and deep cartilage layers of the central and peripheral plug demonstrated significant shortening with increasing duration after surgery (P < 0.004). More stratified T2 repair tissue with shorter values appears at the area of peripheral integration rather than the subchondral repair tissue.
Figure 7.
Figure 7.
Axial quantitative T2 mapping of a trochlear TruFit bone graft substitute plug at 8 months, 13 months, and 27 months postoperatively. T2 relaxation times (milliseconds) for the superficial and deep cartilage layers of the central and peripheral plug demonstrated significant shortening with increasing duration after surgery (P < 0.004). These values approached but always remained prolonged compared with those of normal articular cartilage by final follow-up evaluation. Note: Image adapted with permission from Potter HG, Chong LR, Sneag DB. Magnetic resonance imaging of cartilage repair. Sports Med Arthrosc Rev. 2008 Dec 16(4):236-45.

References

    1. Alford JW, Cole BJ. Cartilage restoration, part 1: basic science, historical perspective, patient evaluation, and treatment options. Am J Sports Med. 2005. February;33(2):295-306. - PubMed
    1. Alford JW, Cole BJ. Cartilage restoration, part 2: techniques, outcomes, and future directions. Am J Sports Med. 2005. March;33(3):443-60. - PubMed
    1. Buckwalter JA, Mankin HJ. Articular cartilage repair and transplantation. Arthritis Rheum. 1998. August;41(8):1331-42. - PubMed
    1. Buckwalter JA, Mankin HJ. Articular cartilage: degeneration and osteoarthritis, repair, regeneration, and transplantation. Instr Course Lect. 1998;47:487-504. - PubMed
    1. Buckwalter JA, Mankin HJ, Grodzinsky AJ. Articular cartilage and osteoarthritis. Instr Course Lect. 2005;54:465-80. - PubMed

LinkOut - more resources