

Quantitative carotid PET/MR imaging: clinical evaluation of MR-Attenuation correction versus CT-Attenuation correction in (18)F-FDG PET/MR emission data and comparison to PET/CT
- PMID: 26069863
- PMCID: PMC4446398
Quantitative carotid PET/MR imaging: clinical evaluation of MR-Attenuation correction versus CT-Attenuation correction in (18)F-FDG PET/MR emission data and comparison to PET/CT
Abstract
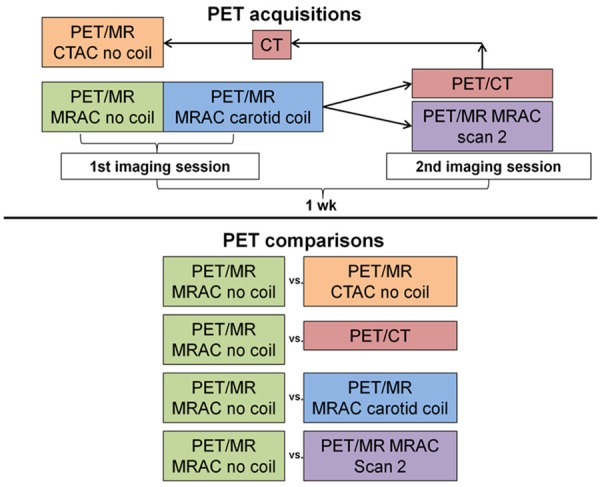
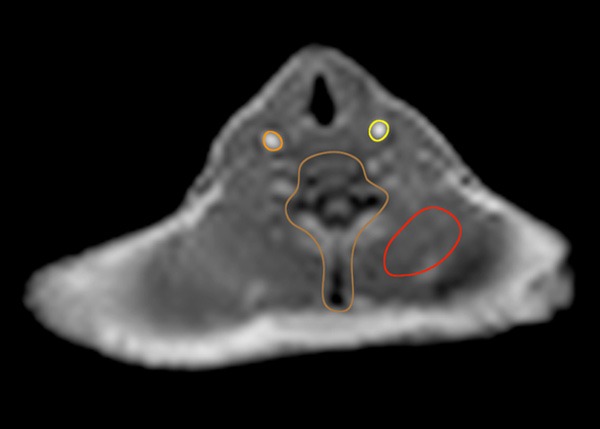
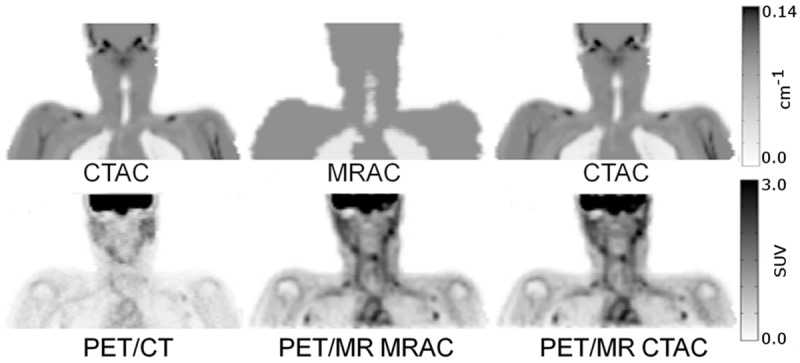
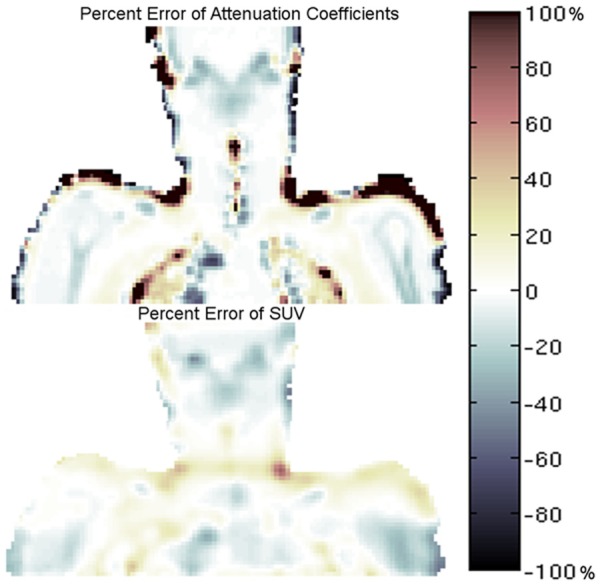
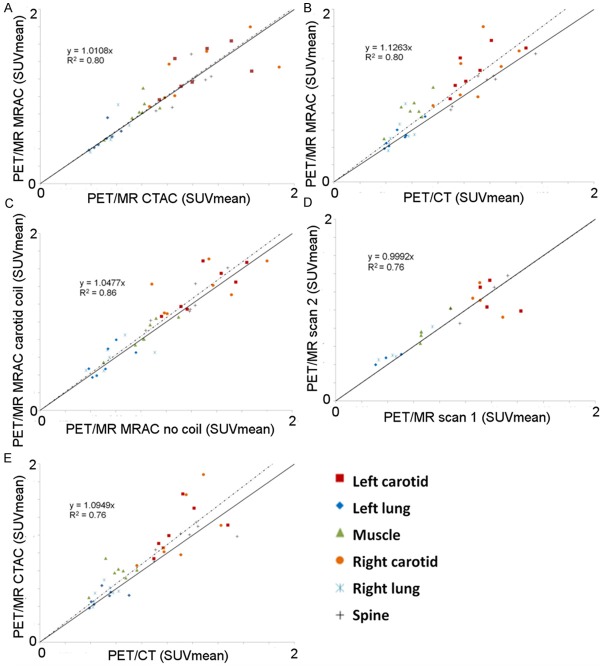
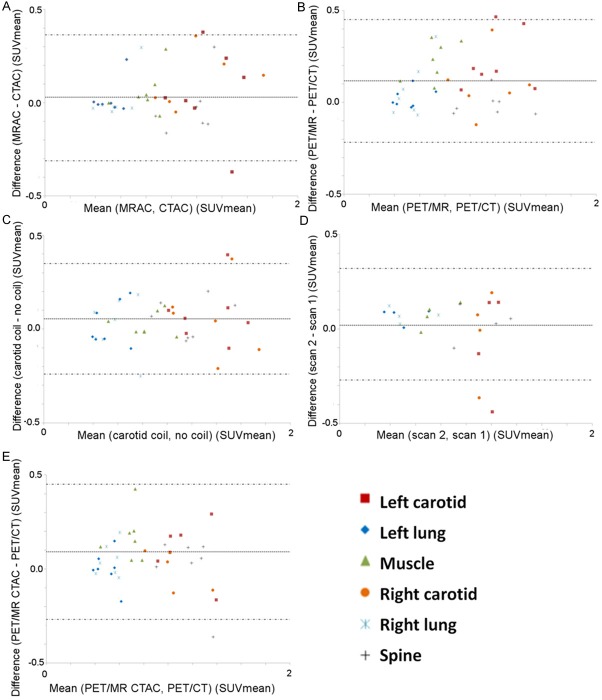
Current PET/MR systems employ segmentation of MR images and subsequent assignment of empirical attenuation coefficients for quantitative PET reconstruction. In this study we examine the differences in the quantification of (18)F-FDG uptake in the carotid arteries between PET/MR and PET/CT scanners. Five comparisons were performed to asses differences in PET quantification: i) PET/MR MR-based AC (MRAC) versus PET/MR CTAC, ii) PET/MR MRAC versus PET/CT, iii) PET/MR MRAC with carotid coil versus PET/MR MRAC without coil, iv) PET/MR MRAC scan 2 versus PET/MR MRAC scan 1, and v) PET/MR CTAC versus PET/CT. Standardized uptakes values (SUV) mean and SUV maximum were calculated for six regions-of-interests: left and right carotid arteries, left and right lungs, spine and muscle. Pearson's Correlation and Bland-Altman plots were used to compare SUV mean and maximum within each ROI of each patient. PET/MR emission data reconstructed with MRAC versus PET/MR emission data reconstructed with CTAC had percent differences of SUV mean ranging from -2.0% (Absolute Difference, -0.02) to 7.4% (absolute difference, 0.06). Percent differences within the carotid arteries proved to correlate well with differences of SUV mean of 5.4% (Absolute Difference, 0.07) in the left carotid and 2.7% (Absolute Difference, 0.03) in the right carotid. Pearson's correlation and Bland-Altman of PET/MR with MRAC versus PET/MR with CTAC showed high correlation between SUV mean (R(2)=0.80, mean difference 0.03 ± 0.18 SUV, p=0.3382), demonstrating excellent correlation within ROIs analyzed. The results of this study support the use of (18)F-FDG PET/MR for quantitative measure of inflammation in the carotid arteries.
Keywords: PET/CT; PET/MR; attenuation correction; cardiovascular; carotid arteries.
Figures
References
-
- Rudd JH, Myers KS, Bansilal S, Machac J, Pinto CA, Tong C, Rafique A, Hargeaves R, Farkouh M, Fuster V, Fayad ZA. Atherosclerosis inflammation imaging with 18F-FDG PET: carotid, iliac, and femoral uptake reproducibility, quantification methods, and recommendations. J Nucl Med. 2008;49:871–8. - PubMed
-
- Libby P, DiCarli M, Weissleder R. The vascular biology of atherosclerosis and imaging targets. J Nucl Med. 2010;51(Suppl 1):33S–37S. - PubMed
-
- Beyer T, Townsend DW, Blodgett T. Dual-modality PET/CT tomography for clinical oncology. Q J Nucl Med. 2002;46:24–34. - PubMed
-
- Delso G, Fürst S, Jakoby B, Ladebeck R, Ganter C, Nekolla SG, Schwaiger M, Ziegler SI. Performance measurements of the Siemens mMR integrated whole-body PET/MR scanner. J Nucl Med. 2011;52:1914–22. - PubMed
Grants and funding
LinkOut - more resources
Full Text Sources