. 2015 Jul 31;290(31):18890-903.
doi: 10.1074/jbc.M115.647941. Epub 2015 Jun 12.

Structural Determinants of the Mechanical Stability of α-Catenin

Affiliations

Structural Determinants of the Mechanical Stability of α-Catenin

Jing Li et al. J Biol Chem. .

Abstract

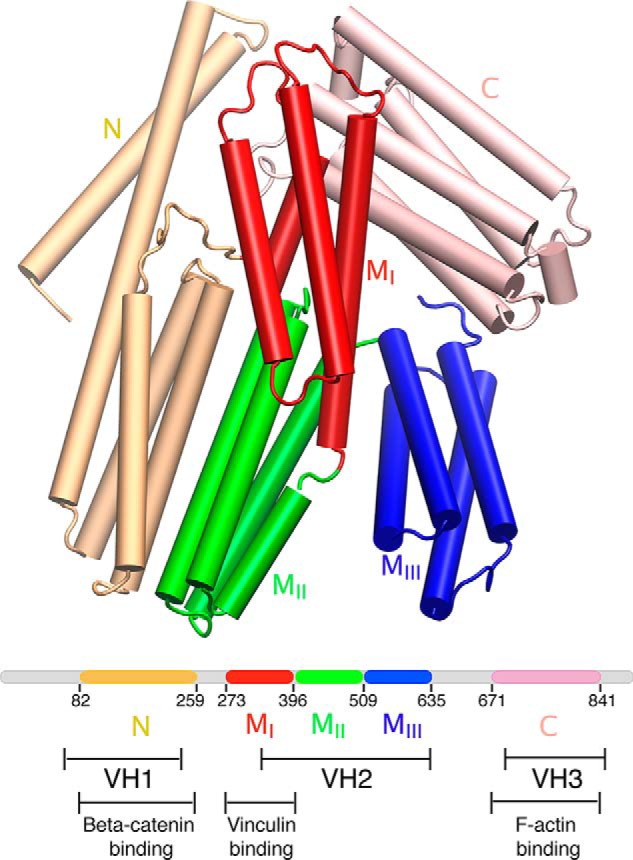
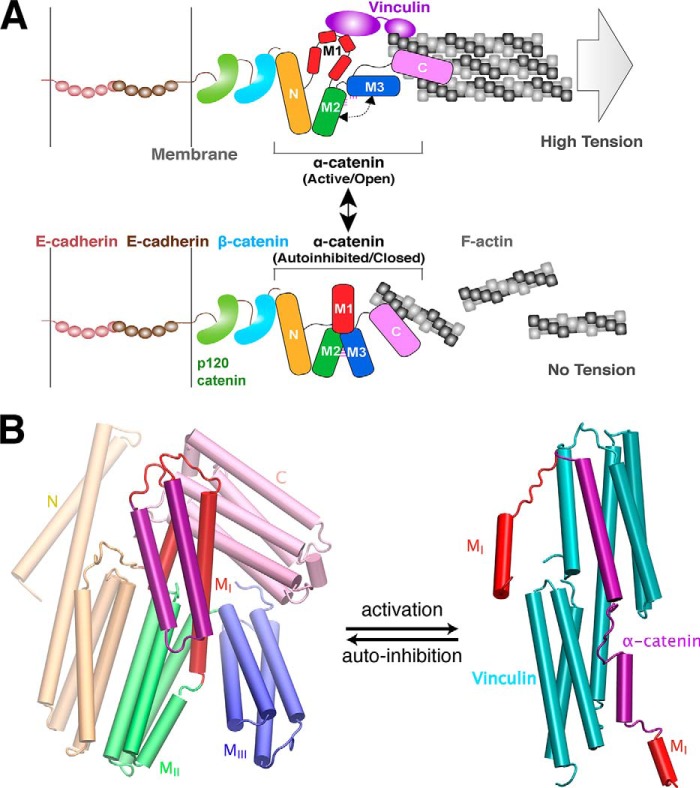
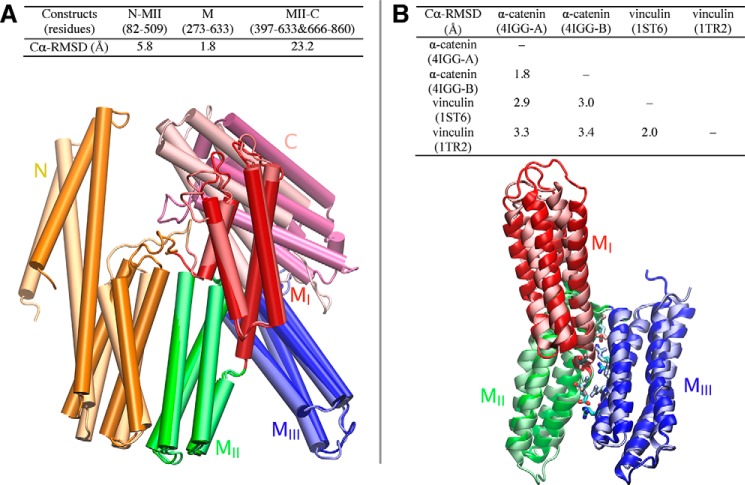
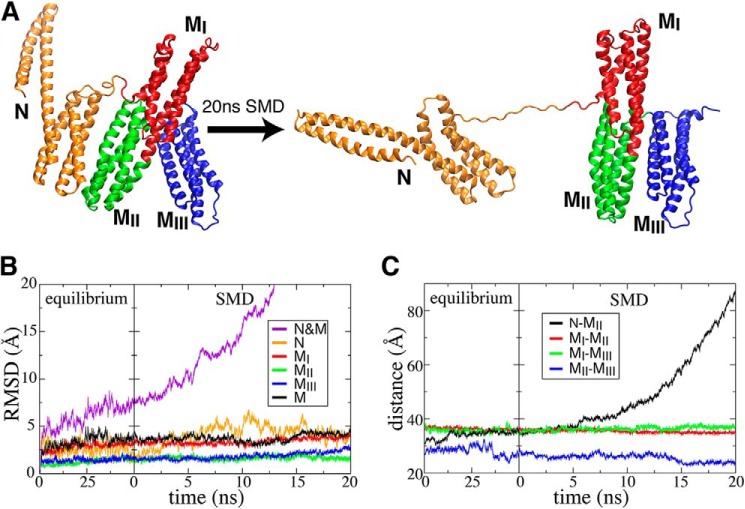
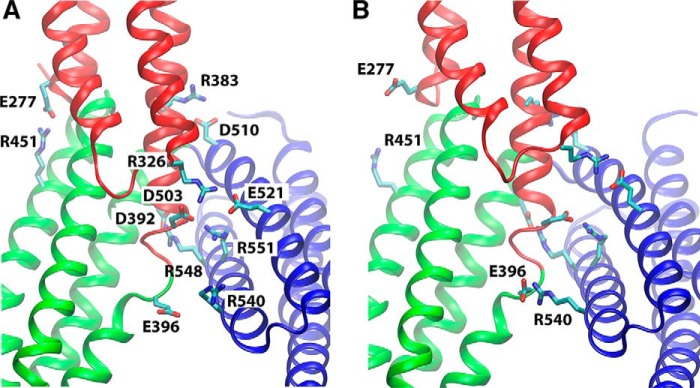
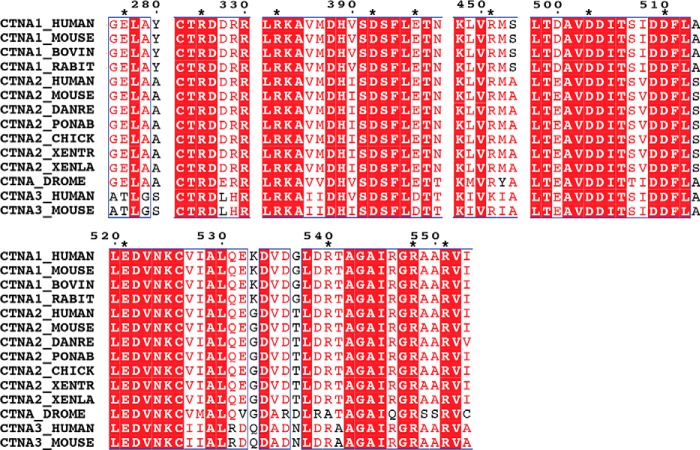
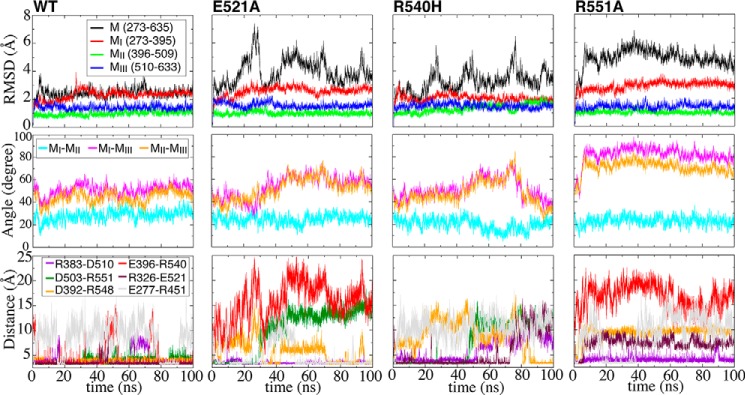
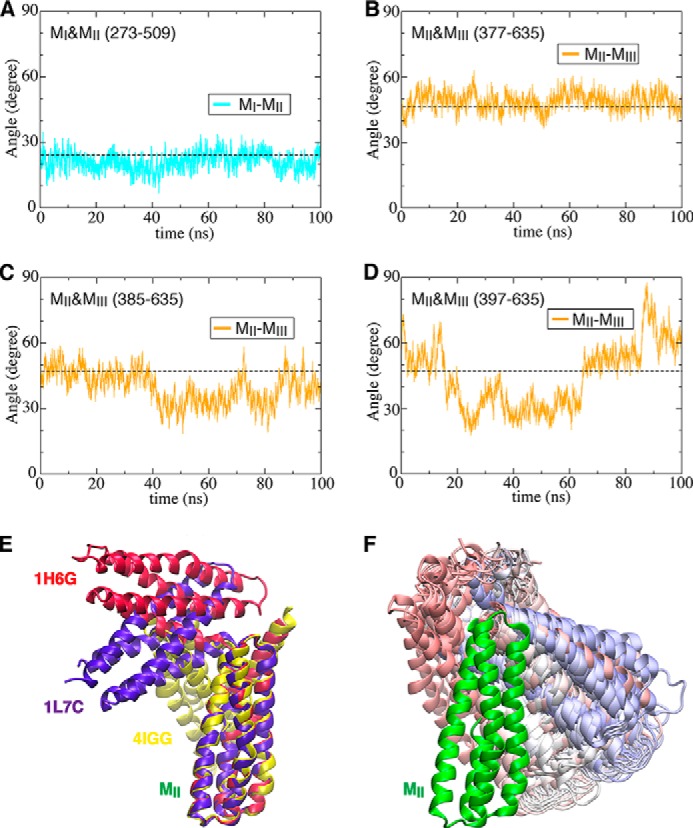
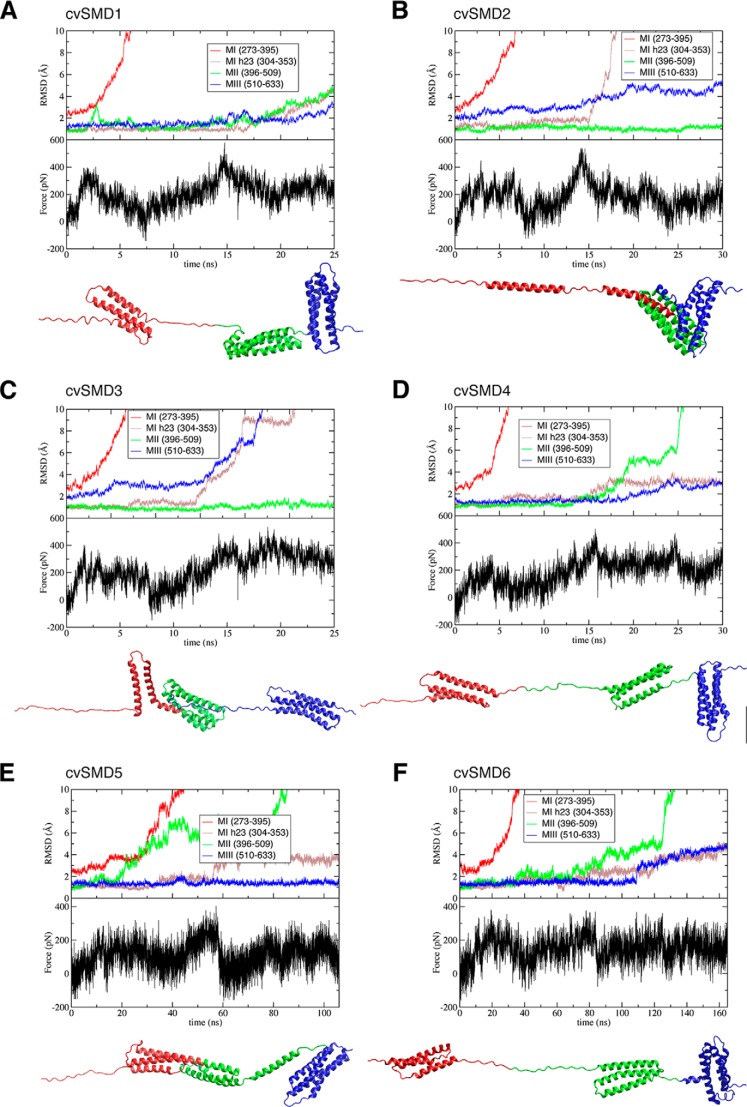
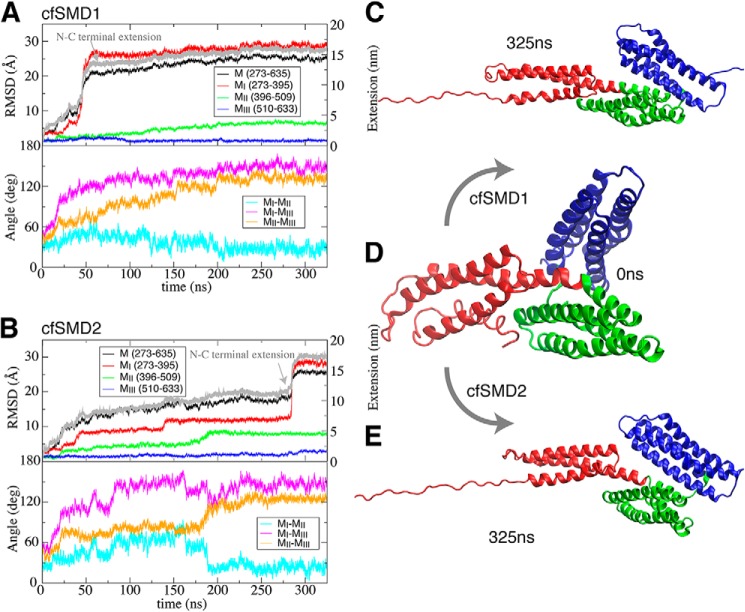
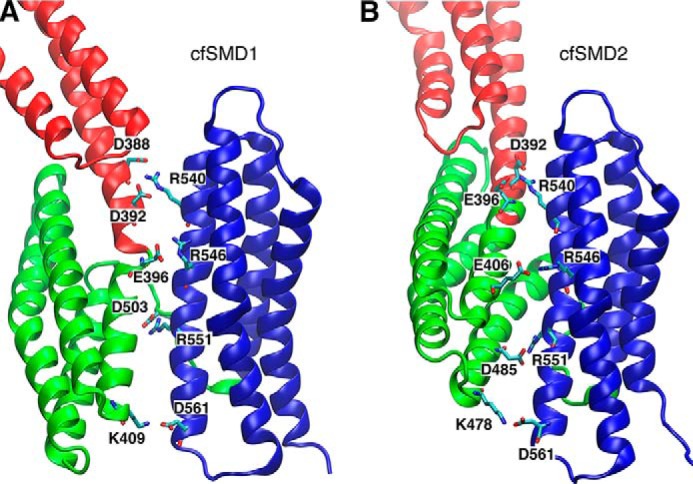
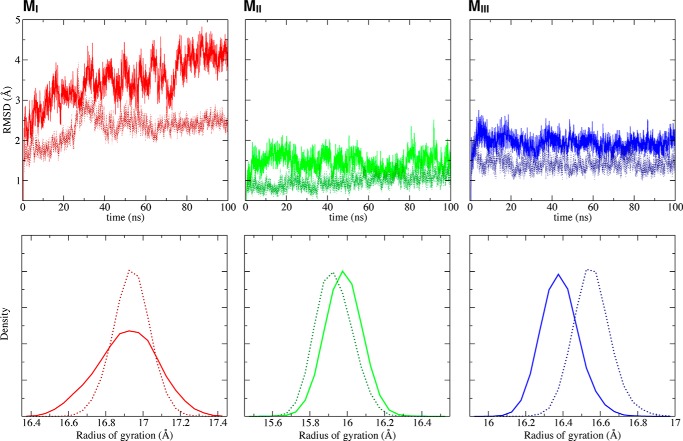
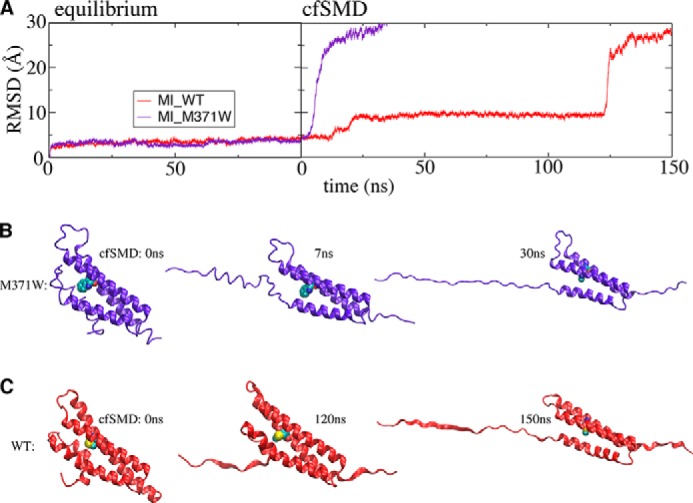
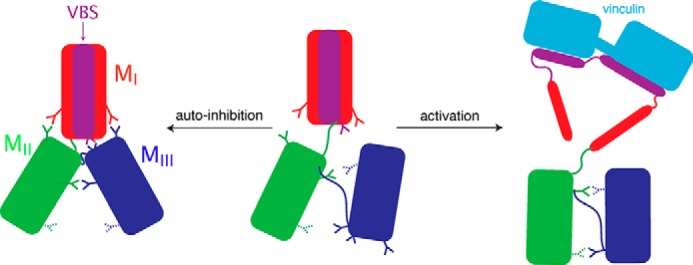
α-Catenin plays a crucial role in cadherin-mediated adhesion by binding to β-catenin, F-actin, and vinculin, and its dysfunction is linked to a variety of cancers and developmental disorders. As a mechanotransducer in the cadherin complex at intercellular adhesions, mechanical and force-sensing properties of α-catenin are critical to its proper function. Biochemical data suggest that α-catenin adopts an autoinhibitory conformation, in the absence of junctional tension, and biophysical studies have shown that α-catenin is activated in a tension-dependent manner that in turn results in the recruitment of vinculin to strengthen the cadherin complex/F-actin linkage. However, the molecular switch mechanism from autoinhibited to the activated state remains unknown for α-catenin. Here, based on the results of an aggregate of 3 μs of molecular dynamics simulations, we have identified a dynamic salt-bridge network within the core M region of α-catenin that may be the structural determinant of the stability of the autoinhibitory conformation. According to our constant-force steered molecular dynamics simulations, the reorientation of the MII/MIII subdomains under force may constitute an initial step along the transition pathway. The simulations also suggest that the vinculin-binding domain (subdomain MI) is intrinsically much less stable than the other two subdomains in the M region (MII and MIII). Our findings reveal several key insights toward a complete understanding of the multistaged, force-induced conformational transition of α-catenin to the activated conformation.

Keywords: cell adhesion; mechanotransduction; molecular dynamics; vinculin; α-catenin.


Figures

FIGURE 1.
FIGURE 1.
Structural arrangement of α-catenin. α-Catenin comprises five helical domains: N (wheat), MI (red), MII (green), MIII (blue), and C (pink) domains. According to the similarity with vinculin, α-catenin is also divided into three vinculin homology (VH) regions as follows: VH1, VH2, and VH3 (36). MI, MII, and MIII domains collectively are referred to as the M region in this study.
FIGURE 2.
FIGURE 2.
Conformational switching model of α-catenin between two known functional states. A, model of α-catenin-dependent interactions between the cadherin-catenin complex and F-actin. As a multidomain protein, α-catenin physically links the cadherin-catenin complex to actin filaments (F-actin) through the N-terminal β-catenin-binding (N) domain and the C-terminal F-actin-binding (C) domain. Top, α-catenin adopts an active, open conformation and binds to vinculin (purple) when the pulling force generated by trans-dimerization of E-cadherin and actomyosin-mediated high tension. Bottom, α-catenin adopts an autoinhibited conformation when it experiences little to no tension. The central modulatory domain, M fragment, is autoinhibited from interacting with various binding partners, such as the F-actin-binding protein vinculin. B, conformational change of vinculin-binding domain (MI, show in red and purple) in α-catenin between two structurally known states as follows: closed (autoinhibited) state (left, PDB code 4IGG) (35) and open (activated) state (right, PDB code 4EHP) (40) upon vinculin binding. Vinculin is shown in cyan in the complex (right).
FIGURE 3.
FIGURE 3.
Structural comparisons between α-catenin monomers and vinculin. A, conformation differences between chain A and B in the crystal structure (PDB code 4IGG) of full-length α-catenin. Superimposition of chain A and B (bottom) shows the conformational differences of five domains. B, structural comparisons among M fragments (VH2) of α-catenin and homologous domains in vinculin. Top, r.m.s.d. between α-catenin and vinculin are measured by STAMP structural alignment. Bottom, superimposition of M fragment of α-catenin (PDB code 4IGG, chain) and homologous domains in vinculin (PDB code 1ST6) show their structural similarity. Several conserved inter-domain salt bridges in both α-catenin and vinculin are shown as sticks.
FIGURE 4.
FIGURE 4.
Structural response of protein construct N-M (residues 82–635) to mechanical force. A, initial and final snapshots of a 20-ns SMD simulation (trajectory 1). Evolution of the backbone r.m.s.d. (B) and centers of mass distances between pairwise domains (C) are shown as a function of time during the initial 50-ns equilibrium (trajectory 1) and the following SMD simulation (trajectory 22).
FIGURE 5.
FIGURE 5.
Inter-domain salt-bridge network in the core M region. Salt bridges between M subdomains are shown for the crystal structure (PDB code 4IGG) (35) (A) and for a representative snapshot taken from the equilibrium simulation (trajectory 2) where the newly formed Glu-396–Arg-540 salt bridge is highlighted (B).
FIGURE 6.
FIGURE 6.
Sequence alignment of α-catenin family for the motifs relevant to the salt-bridge network. Sequences are obtained from the Universal Protein Resource. The stars indicate the charged residues constituting the salt-bridge network.
FIGURE 7.
FIGURE 7.
Cooperative salt-bridge network to stabilize the core M region. Evolution of backbone r.m.s.d. (top), inter-domain angles (middle), and salt-bridge distances (bottom) as a function of time during equilibrium simulations of wild type α-catenin (trajectory 2) and three mutants (trajectories 5–7). Inter-domain angle is measured as the angle between the principal axes of pairwise domains.
FIGURE 8.
FIGURE 8.
Variability of the angle between MII and MIII influenced by MI–MII linker length. Evolution of inter-domain angles as a function of time during equilibrium simulations is shown for MI and MII (A) (trajectory 8) or for MII and MIII (B–D) (trajectories 9–11). E, three crystallographic structures available for the MII and MIII subdomains of α-catenin, superimposed on the MII subdomain. F, 100 snapshots (colored from red to blue as a function of time) of the MIII subdomain taken from the equilibrium simulation (protein construct (397–635), trajectories 11) superimposed on the MII subdomain.
FIGURE 9.
FIGURE 9.
Inconsistency of conformational changes during cv-SMD simulations for the MI–MIII fragment. Six cv-SMD simulations were performed at different velocities: cv-SMD1, cv-SMD2, cv-SMD3, and cv-SMD4 were pulled with a constant velocity of 10 Å/ns, although the velocity in cv-SMD5 and cv-SMD6 is 2 Å/ns. Backbone r.m.s.d. of each domain, and the vinculin-binding site (the 2nd and 3rd α-helices (MI h23)), are measured to show different patterns of conformational changes. The force-time profile and final conformation are shown for each cv-SMD.
FIGURE 10.
FIGURE 10.
MII/MIII reorientation in response to mechanical force. Two separate cf-SMD simulations (trajectories 29 and 30) for the MI–MIII fragment (A and B) started from the same initial conformation (D) and converged to similar conformations (C and E) after 325 ns, which may represent an important intermediate. Evolution of the backbone r.m.s.d. of the MI–MIII fragment and each domain, extension change of N- and C-terminal of M region, and relative angles of pairwise domains are measured during 325-ns cf-SMD simulations (A and B). The constant force in both simulations is 100 pN.
FIGURE 11.
FIGURE 11.
Inter-domain salt bridges between MII and MIII subdomains after the MII/MIII reorientation during the cf-SMD simulations (trajectories 29 and 30). Salt bridges are shown in the last conformation after 325-ns cf-SMD simulations, cf-SMD1 (A) and cf-SMD2 (B). The second helix in the MIII subdomain is a conserved site with several charged residues (Arg-540, Arg-546, Arg-551, and Asp-561), which form salt bridges with the MII subdomain.
FIGURE 12.
FIGURE 12.
Stability of each subdomain within the core M region, during single-domain equilibrium simulations (trajectories 12, 15, and 17). The backbone r.m.s.d., respectively, for MI (left), MII (middle), and MIII (right) subdomains are shown as solid line in the top panel, and the distributions of radius of gyration for each domain are in the bottom panel. The corresponding values for each subdomain when simulated within the context of the whole M region (trajectory 2) are provided as dotted lines in each plot for comparison.
FIGURE 13.
FIGURE 13.
Conformational dynamics of the wild type MI domain and its mutant M371W during single-domain equilibrium (trajectories 12 and 19) and cf-SMD simulations (trajectories 31 and 33). A, backbone r.m.s.d. of the MI domain are shown as a function of time. Several snapshots during cf-SMD simulations are shown for mutant M371W (B) and wild type (C) MI subdomains. The constant force in both simulations is 100 pN.
FIGURE 14.
FIGURE 14.
Model for the conformational switch of α-catenin between the autoinhibited state and the active state that can bind vinculin. The vinculin-binding site (VBS) in the MI subdomain is in purple. Vinculin is in cyan. The inter-domain salt bridges critical for autoinhibition are shown as solid sticks, and other charged residues important for MII/MIII interaction after reorientation are shown as striped sticks.

References

    1. Hahn C., Schwartz M. A. (2009) Mechanotransduction in vascular physiology and atherogenesis. Nat. Rev. 10, 53–62 - PMC - PubMed
    1. Vogel V., Sheetz M. (2006) Local force and geometry sensing regulate cell functions. Nat. Rev. Mol. Cell Biol. 7, 265–275 - PubMed
    1. Schwartz M. A. (2010) Integrins and extracellular matrix in mechanotransduction. Cold Spring Harb. Perspect. Biol. 2, a005066. - PMC - PubMed
    1. Lecuit T., Lenne P. F., Munro E. (2011) Force generation, transmission, and integration during cell and tissue morphogenesis. Annu. Rev. Cell Dev. Biol. 27, 157–184 - PubMed
    1. Hytönen V. P., Vogel V. (2008) How force might activate talin's vinculin binding sites: SMD reveals a structural mechanism. PLoS Comput. Biol. 4, e24. - PMC - PubMed

Publication types