. 2015 Aug;22(4):279-91.
doi: 10.1093/dnares/dsv009. Epub 2015 Jun 11.

Making a chocolate chip: development and evaluation of a 6K SNP array for Theobroma cacao

Affiliations

Making a chocolate chip: development and evaluation of a 6K SNP array for Theobroma cacao

Donald Livingstone et al. DNA Res. 2015 Aug.

Abstract

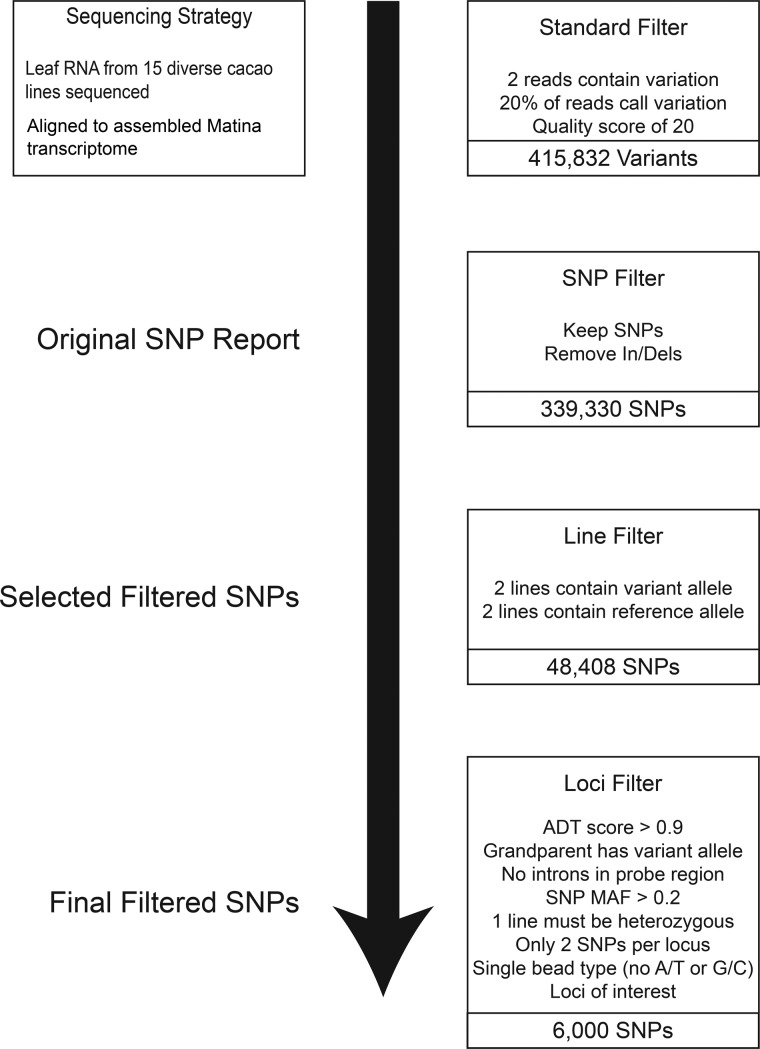
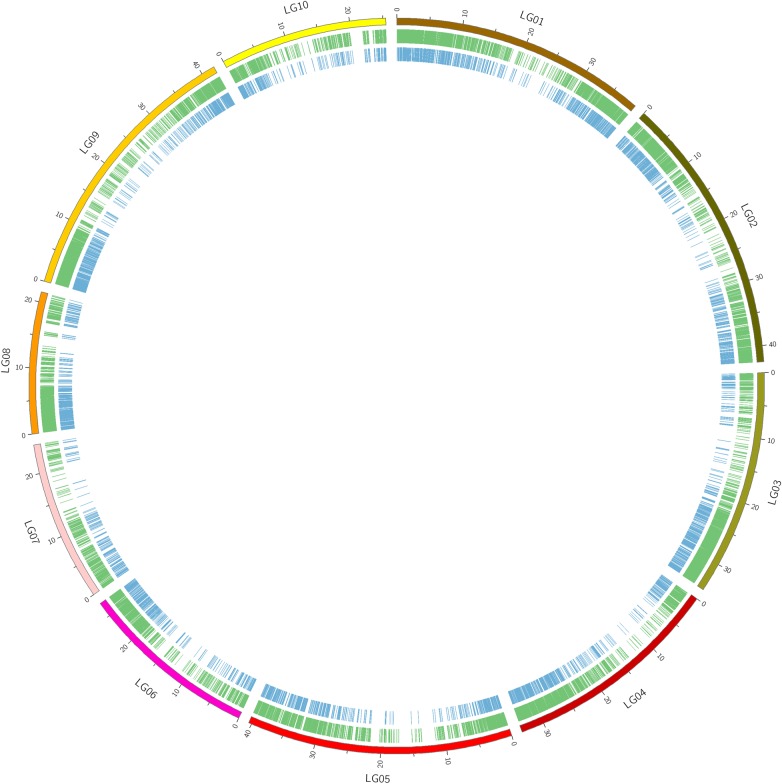
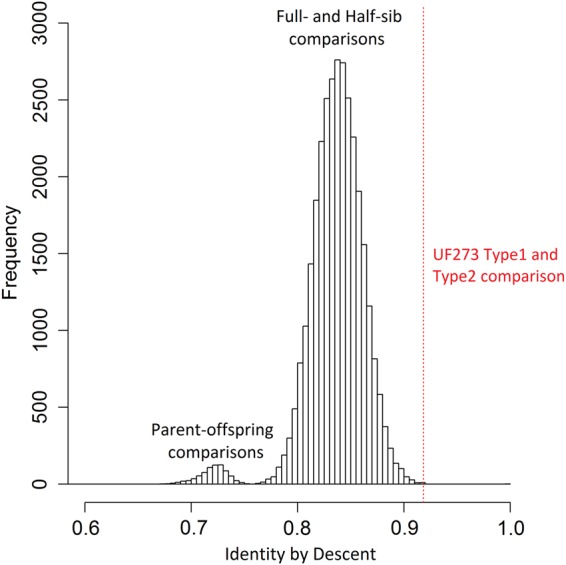
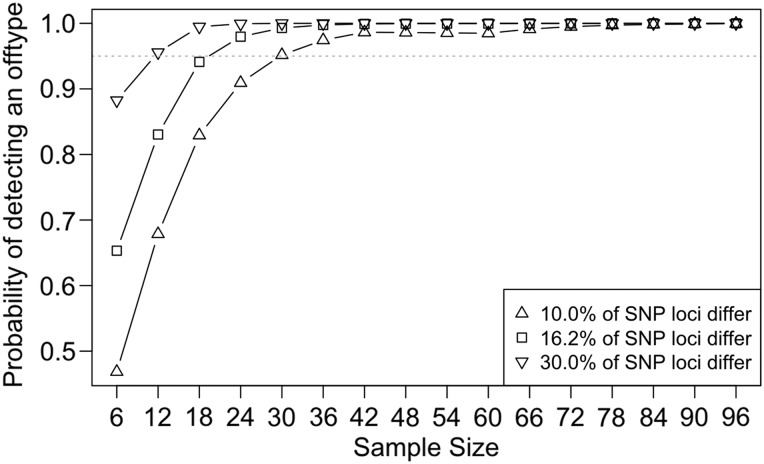
Theobroma cacao, the key ingredient in chocolate production, is one of the world's most important tree fruit crops, with ∼4,000,000 metric tons produced across 50 countries. To move towards gene discovery and marker-assisted breeding in cacao, a single-nucleotide polymorphism (SNP) identification project was undertaken using RNAseq data from 16 diverse cacao cultivars. RNA sequences were aligned to the assembled transcriptome of the cultivar Matina 1-6, and 330,000 SNPs within coding regions were identified. From these SNPs, a subset of 6,000 high-quality SNPs were selected for inclusion on an Illumina Infinium SNP array: the Cacao6kSNP array. Using Cacao6KSNP array data from over 1,000 cacao samples, we demonstrate that our custom array produces a saturated genetic map and can be used to distinguish among even closely related genotypes. Our study enhances and expands the genetic resources available to the cacao research community, and provides the genome-scale set of tools that are critical for advancing breeding with molecular markers in an agricultural species with high genetic diversity.

Keywords: SNP; breeding; cacao; mapping; markers.


Figures

Figure 1.
Figure 1.
SNP discovery and filtering for the selection of 6,000 SNPs for inclusion on the Cacao6kSNP array. Variants identified by alignment to an early Matina reference transcriptome. Standard filtering was applied to provide confidence in the existence of the variants. SNP Filter was applied to retain only biallelic SNP variants, referred to as the Original SNP Report. As a measure of added confidence, only those SNPs for which at least two accessions displayed the variant allele and two accessions displayed the reference allele were kept (Selected Filtered SNPs). Additional loci filtering was applied to reduce the number of selected SNPs down to the targeted final filtered SNPs, which were included on the Cacao6kSNP array.
Figure 2.
Figure 2.
Location of SNP sets along the Matina 1-6 genome. The 10 chromosomes of the Matina 1-6 genome assembly are represented along the outer ring (LG01–LG10). The middle ring highlights the locations of 48,408 select filtered SNPs, while the inner ring highlights the locations of the 6,000 final filtered SNPs. This figure is available in black and white in print and in colour at DNA Research online
Figure 3.
Figure 3.
GOslim annotation of SNP-containing gene models. Gene models from the Matina 1-6 assembly were screened to identify the final selected SNP set. Goslim annotation was used to classify the SNP-containing gene models. The top chart represents cellular components, the middle describes molecular function and the bottom refers to biological process. The X-axis shows the total number of SNP-containing gene models. The percentage after the bar represents the percent of SNP-containing gene models within each annotated group.
Figure 4.
Figure 4.
IBD distribution for all CATIE Type 1 and Type 2 pair-wise comparisons (including parents). The left mode of the bimodal curve reflects the IBD distribution for parent–offspring relationships (as well as two parent-to-parent IBDs: Pound 7 versus UF273 Type I and Pound 7 versus UF273 Type II). The right mode reflects the full-sibling and half-sibling pair-wise IBDs. The dashed line represents the UF273 Type I versus UF273 Type II pair-wise IBD value (0.92), indicating a first-degree relationship. This figure is available in black and white in print and in colour at DNA Research online
Figure 5.
Figure 5.
Probability of differentiating accessions of various levels of identity using increasing numbers of SNP markers. The probability of successfully differentiating accessions with 10% (Δ), 16.2% (□; as observed with UF273 Type I and Type II) and 30% (∇) genetic variation using a number of randomly selected loci as calculated using the binomial distribution. A confidence threshold of 95%, with a 0.01 genotyping error rate, was selected to identify different accessions. Thirty SNPs are sufficient to distinguish accessions with only 10% variation.
Figure 6.
Figure 6.
Venn diagram detailing the number of SNP markers that can be mapped, i.e. those with at least one heterozygous parent, in a particular population. The population name is listed above with the total number of markers that can be mapped in parenthesis. Markers that segregate within each population are represented by a coloured rectangle: CATIE Type 1 markers in blue, CATIE Type 2 markers in green, PNG in red and MCCS in purple. Overlapping rectangles indicate markers shared between those populations. Numbers within rectangles represent the number of markers that can be mapped within those population(s).
Figure 7.
Figure 7.
Linkage map of the Pound 7 × UF273 Type II mapping population. Linkage map representing the 10 identified chromosomes of cacao. The map was generated with JoinMap 4.1 and contains 68 individuals with 2,589 markers. Markers are depicted as black lines with their position (cM) reported to the left. Linkage group designation is indicated across the top, markers are identified as horizontal lines and cM position is indicated along the left.
Figure 8.
Figure 8.
Comparison of SNP marker positions. Marker positions are depicted as grey lines and show marker position either by linkage mapping (CATIE Type 2) or blasting 121-mers containing the SNP to the genomic assemblies of Criollo or Matina. Tc00 contains unanchored sequences in the Criollo assembly. No markers present on the CATIE Type 2 map were located on unanchored sequences in the Matina assembly. This demonstrates the advantages of a more saturated genetic map in genome assembly.

References

    1. Food and Agriculture Organization of the United Nations. 2015. FAOSTAT. Crops (National Production). http://data.fao.org/ref/29920434-c74e-4ea2-beed-01b832e60609.html?versio... (6 March 2014, date last accessed).
    1. Cuatrecasas J. 1964, Cacao and its allies: a taxonomic revision og the genus Theobroma, Contrib. US Herbarium, 35, 542–3.
    1. Hunter J.R. 1990, The status of cacao (Theobroma-Cacao, Sterculiaceae) in the western-hemisphere, Econ. Bot., 44, 425–39.
    1. Motamayor J.C., Risterucci A.M., Lopez P.A., Ortiz C.F., Moreno A., Lanaud C. 2002, Cacao domestication I: the origin of the cacao cultivated by the Mayas, Heredity, 89, 380–6. - PubMed
    1. Fredholm A. 1911, Breeding of cacao, The West India Committee Circular, 102–3.

Publication types

LinkOut - more resources