. 2015 Sep;65(5):451-9.
doi: 10.1007/s12576-015-0384-5. Epub 2015 Jun 13.

Breathing abnormalities in a female mouse model of Rett syndrome

Affiliations

Breathing abnormalities in a female mouse model of Rett syndrome

Christopher M Johnson et al. J Physiol Sci. 2015 Sep.

Abstract

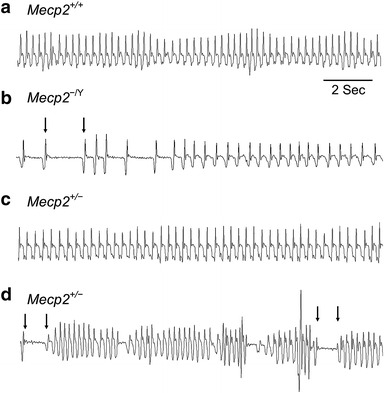
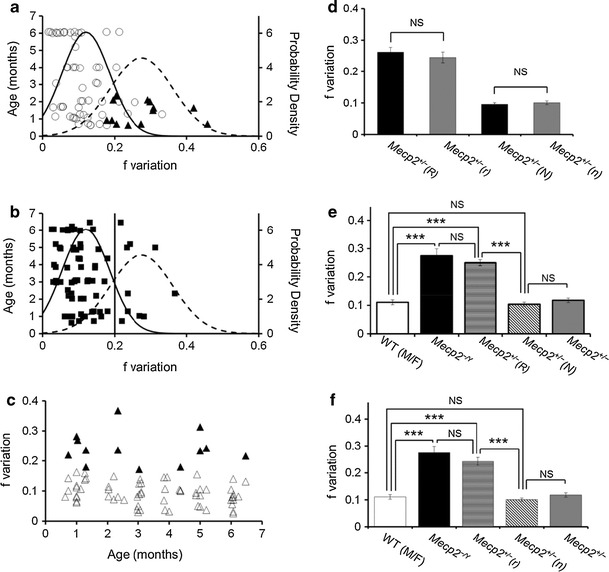
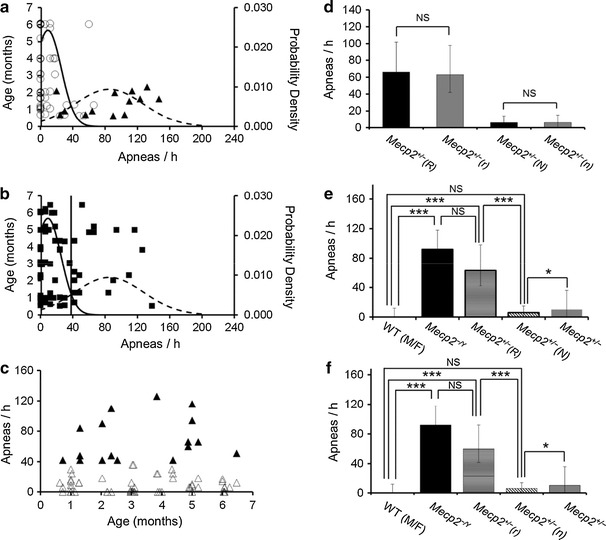
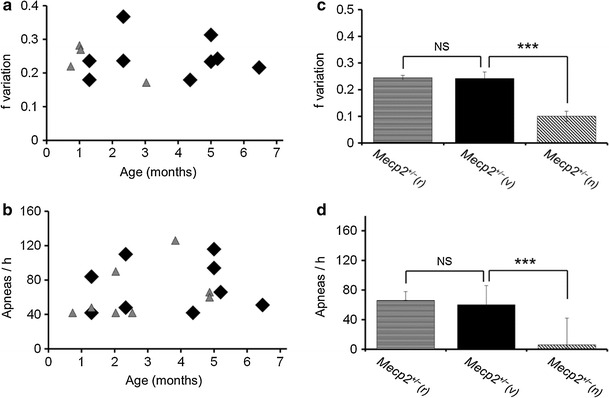
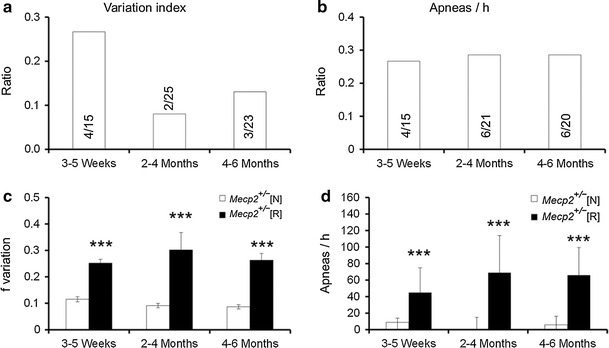
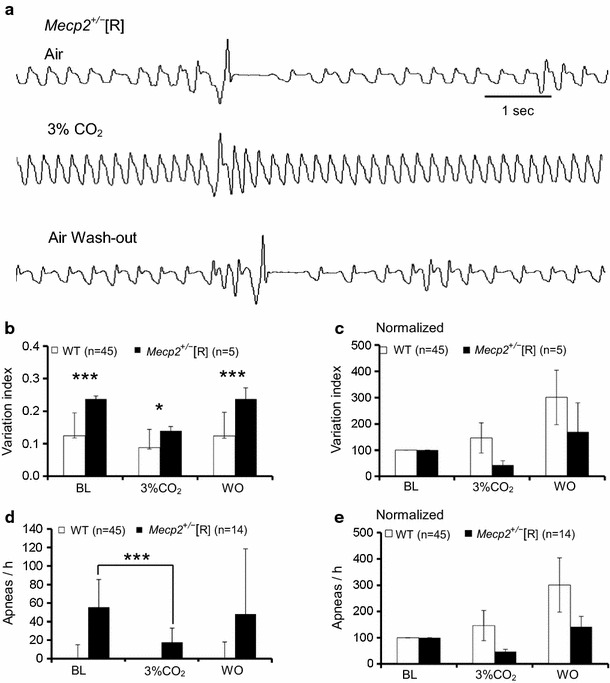
Rett syndrome (RTT) is a female neurodevelopmental disease with breathing abnormalities. To understand whether breathing defects occur in the early lives of a group of female Mecp2(+/-) mice, a mouse model of RTT, and what percentage of mice shows RTT-like breathing abnormality, breathing activity was measured by plethysmography in conscious mice. Breathing frequency variation and central apnea in a group of Mecp2(+/-) females displayed a distribution pattern similar to Mecp2(-/Y) males, while the rest resembled the wild-type mice. Similar results were obtained using the k-mean clustering statistics analysis. With two independent methods, about 20% of female Mecp2(+/-) mice showed RTT-like breathing abnormalities that began as early as 3 weeks of age in the Mecp2(+/-) mice, and were suppressed with 3% CO2. The finding that only a small proportion of Mecp2(+/-) mice develops RTT-like breathing abnormalities suggests incomplete allele inactivation in the RTT-model Mecp2(+/-) mice.


Conflict of interest statement

The authors declare that they have no conflict of interest.

Figures

Fig. 1
Fig. 1
Mecp2 +/+ and Mecp2 −/Y mice show typical normal and abnormal breathing patterns, respectively. a Mecp2 +/+ mice exhibit normal inspiration (downdraft) and expiration breathing patterns. b Mecp2 −/Y mice display stereotypical irregular breathing patterns. Arrows indicate an example of apnea. c An example trace of a Mecp2 +/− mouse that exhibits normal breathing patterns. d An example trace of a Mecp2 +/− mouse that exhibits breathing patterns similar to Mecp2 −/Y mice
Fig. 2
Fig. 2
Separation of Mecp2 +/ mice based on f variation. a The f variation distribution of both WT (n = 56) and Mecp2 −/Y (n = 13) mice against ages showed typical Gaussian distributions. WT mice are represented as open circles, Mecp2 −/Y mice are represented as black triangles. b The f variation distribution of Mecp2 +/ mice show two peaks that fit fairly to the Gaussian distributions of WT and Mecp2 −/Y mice in (a). The vertical line at 0.20 indicates the intersection point that was used as a threshold to Mecp2 +/ mice with and without breathing f variation. Of 75 Mecp2 +/ mice, 52 individual Mecp2 +/− female mice were tested. Thirteen were tested 2 to 4 times with no less than a month between tests. c Mecp2 +/ mice were separated based on the k-means clustering method. RTT-like Mecp2 +/ mice are represented as black triangles, and WT-like Mecp2 +/ mice are represented as open triangles. d RTT-like Mecp2 +/− and WT-like Mecp2 +/− mice indicated by the threshold level show no significant differences from those indicated by the k-means clustering method. e With the threshold separation, 13 Mecp2 +/ mice (Mecp2 +/[R]) showed f variation like the Mecp2 −/Y, which have significant difference from the WT but not the Mecp2 −/Y mice. The rest of the WT-like Mecp2 +/ mice (Mecp2 +/[N], n = 62) showed no significant difference in f variation from the WT. f When the f variation was separated using the k-means clustering method, the RTT-like Mecp2 +/ mice (n = 13, Mecp2 +/[r]) have significant difference from WT (n = 56) but not from Mecp2 −/Y mice. Vice versa for the WT-like Mecp2 +/ mice (Mecp2 +/[n], n = 62). Data are presented as mean ± SE (*P < 0.05, ***P < 0.005)
Fig. 3
Fig. 3
Separation of Mecp2 +/ mice based on number of apneas. a Both WT (n = 56, open circles) and Mecp2 −/Y (n = 13, black triangles) mice show typical Gaussian distributions of the number of apneas. b Mecp2 +/ mice are represented as black squares. The vertical line represents the separation level at 38 apneas/h. c Mecp2 +/ mice were separated based on the k-means clustering method. RTT-like Mecp2 +/ mice (n = 17) are represented as black triangles, and WT-like Mecp2 +/ (n = 58) mice are represented as open triangles. d RTT-like Mecp2 +/− and WT-like Mecp2 +/− mice indicated by the threshold level show no significant differences from those indicated by the k-means clustering method. e When separated using the determined threshold level, Mecp2 −/Y mice and the RTT-like Mecp2 +/ mice have no significant difference and WT (n = 56) and the WT-like Mecp2 +/ mice (n = 58) have no significant difference. Data is presented as median ± IQ (*P < 0.05, ***P < 0.005). f When separated based on the number of apneas using the k-means clustering method, Mecp2 −/Y (n = 13) mice and the RTT-like Mecp2 +/ mice (n = 17) have no significant difference and WT (n = 56) and the WT-like Mecp2 +/ mice (n = 58) have no significant difference. Data is presented as median ± IQ (*P < 0.05, ***P < 0.005)
Fig. 4
Fig. 4
RTT-like Mecp2 +/ mice with both significant f variation and apneas. a, b Mecp2 +/ mice with significant f variations and apneas (Mecp2 +/[v], large diamond) indicated by the k-means clustering analysis were compared with Mecp2 +/ mice showing significant f variation only (Mecp2 +/[r], gray triangles). Regarding severity of f variations, Mecp2 +/[v] mice were not significantly different from Mecp2 +/[r]. c, d Severity of apnea was not significantly different between Mecp2 +/[v] and Mecp2 +/[r], either. Data are presented as mean ± SE (***P < 0.005) d Data is presented as median ± IQ (***P < 0.005)
Fig. 5
Fig. 5
Severity and occurrence rate of breathing irregularities in Mecp2 +/ mice. a The ratio of RTT-like Mecp2 +/ mice to WT-like Mecp2 +/ mice based on f variation separation during the different age groups. b The ratio of RTT-like Mecp2 +/ mice to WT-like Mecp2 +/ mice based on the number of apneas/h separation during the different age groups. c The severities of f variation of the Mecp2 +/ during the different age groups. Data is presented as mean ± SE (***P < 0.005). d The numbers of apneas/h of the Mecp2 +/ during the different age groups. Data is presented as median ± IQ (***P < 0.005)
Fig. 6
Fig. 6
Mecp2 +/ mice show reduced severities of breathing irregularities in response to 3 % CO2. a Representative traces of a Mecp2 +/ mouse during normal air ventilation, 3 % CO2, and normal air washout. b, c Statistical analysis was performed in Mecp2 +/ mice and WT mice. Significant suppression of f variation (b, c) and apnea (d, e) was found with 3 % CO2. Normalized f variation (c) and apnea (e). Data is presented as mean ± SE (*P < 0.05) and median ± IQ (*P < 0.05, ***P < 0.005), respectively. BL baseline, WO washout, WT wild-type

References

    1. Neul JL, Kaufmann WE, Glaze DG, Christodoulou J, Clarke AJ, Bahi-Buisson N, Leonard H, Bailey ME, Schanen NC, Zappella M, Renieri A, Huppke P, Percy AK, RettSearch C. Rett syndrome: revised diagnostic criteria and nomenclature. Ann Neurol. 2010;68(6):944–950. doi: 10.1002/ana.22124. - DOI - PMC - PubMed
    1. Chahrour M, Zoghbi HY. The story of Rett syndrome: from clinic to neurobiology. Neuron. 2007;56(3):422–437. doi: 10.1016/j.neuron.2007.10.001. - DOI - PubMed
    1. Guy J, Cheval H, Selfridge J, Bird A. The role of MeCP2 in the brain. Annu Rev Cell Dev Biol. 2011;27:631–652. doi: 10.1146/annurev-cellbio-092910-154121. - DOI - PubMed
    1. Katz DM, Dutschmann M, Ramirez JM, Hilaire G. Breathing disorders in Rett syndrome: progressive neurochemical dysfunction in the respiratory network after birth. Respir Physiol Neurobiol. 2009;168(1–2):101–108. doi: 10.1016/j.resp.2009.04.017. - DOI - PMC - PubMed
    1. Ramirez JM, Ward CS, Neul JL. Breathing challenges in Rett syndrome: lessons learned from humans and animal models. Respir Physiol Neurobiol. 2013;189(2):280–287. doi: 10.1016/j.resp.2013.06.022. - DOI - PMC - PubMed

Publication types

MeSH terms