Clinical Trial
. 2015 Jul 31;33(32):4025-34.
doi: 10.1016/j.vaccine.2015.05.088. Epub 2015 Jun 10.

Safety and immunogenicity of candidate vaccine M72/AS01E in adolescents in a TB endemic setting

Affiliations
Clinical Trial

Safety and immunogenicity of candidate vaccine M72/AS01E in adolescents in a TB endemic setting

Adam Penn-Nicholson et al. Vaccine. .

Abstract

Background: Vaccination that prevents tuberculosis (TB) disease, particularly in adolescents, would have the greatest impact on the global TB epidemic. Safety, reactogenicity and immunogenicity of the vaccine candidate M72/AS01E was evaluated in healthy, HIV-negative adolescents in a TB endemic region, regardless of Mycobacterium tuberculosis (M.tb) infection status.

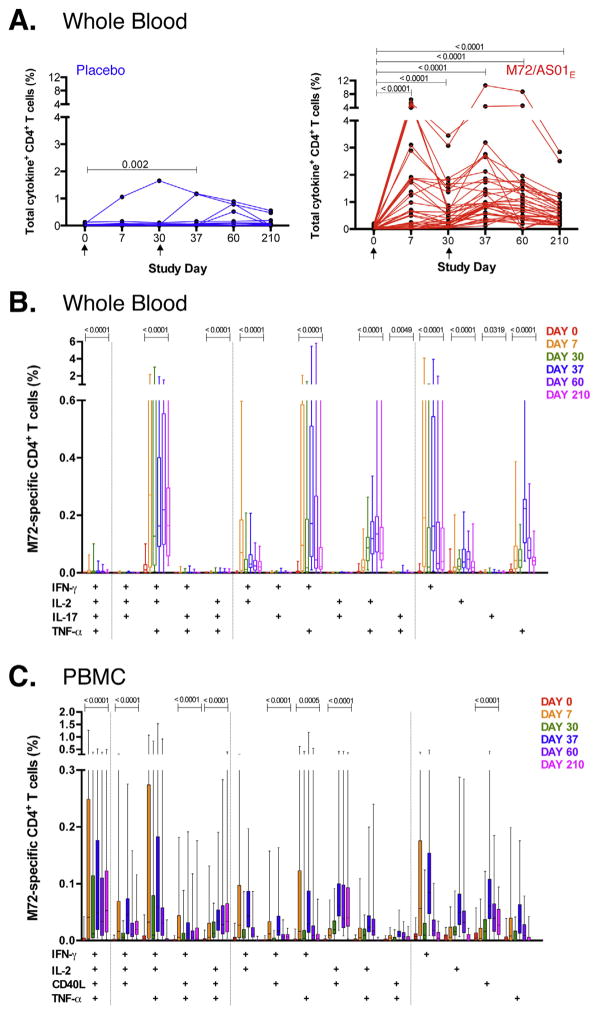
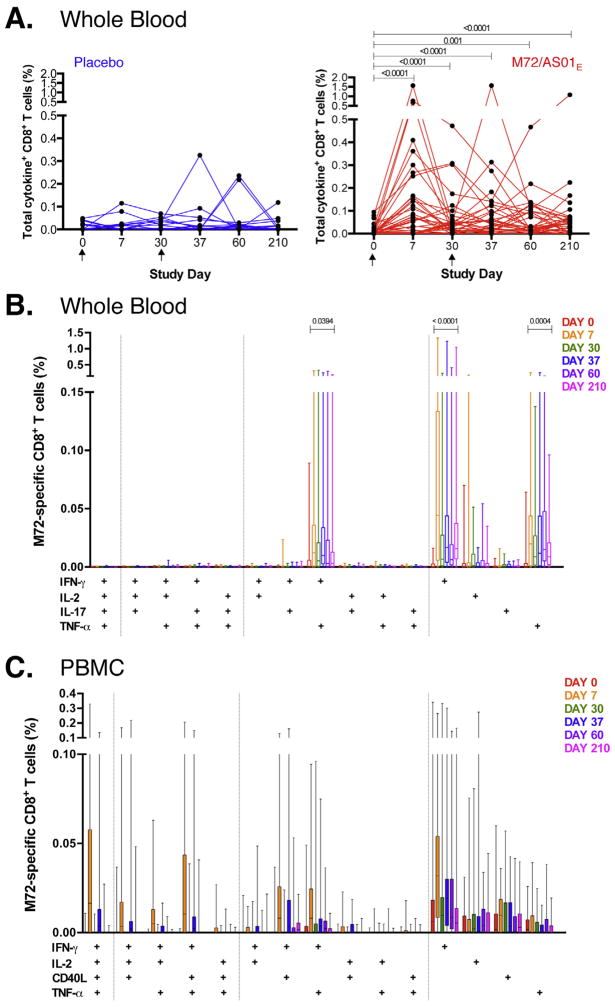
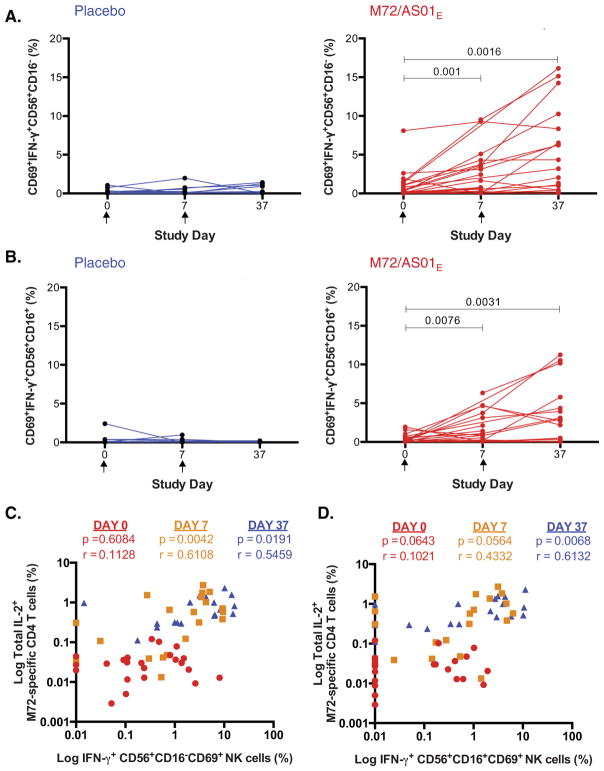
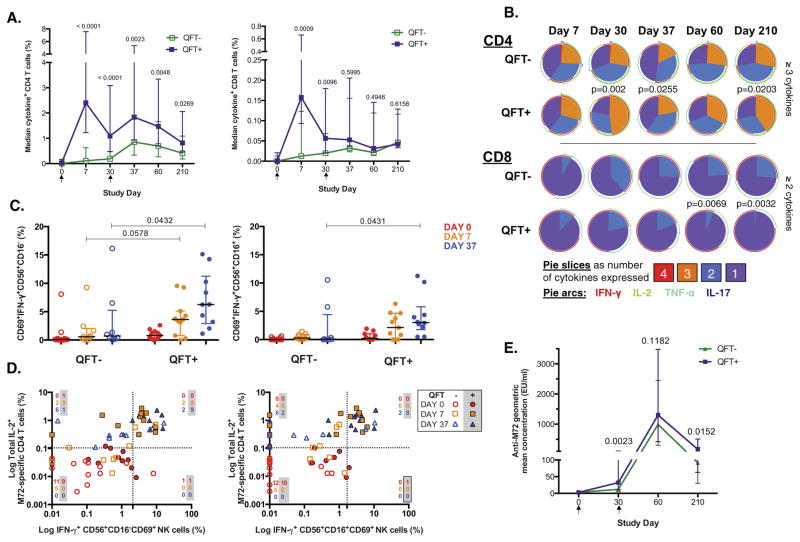
Methods: In a phase II, double-blind randomized, controlled study (NCT00950612), two doses of M72/AS01E or placebo were administered intramuscularly, one month apart. Participants were followed-up post-vaccination, for 6 months. M72-specific immunogenicity was evaluated by intracellular cytokine staining analysis of T cells and NK cells by flow cytometry.

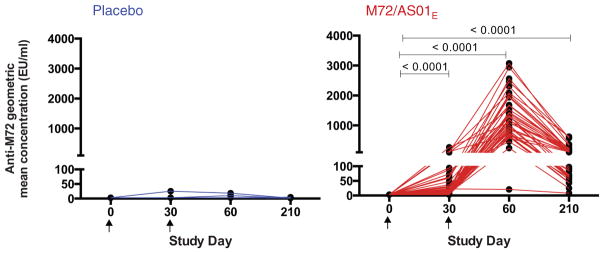
Results: No serious adverse events were recorded. M72/AS01E induced robust T cell and antibody responses, including antigen-dependent NK cell IFN-γ production. CD4 and CD8 T cell responses were sustained at 6 months post vaccination. Irrespective of M.tb infection status, vaccination induced a high frequency of M72-specific CD4 T cells expressing multiple combinations of Th1 cytokines, and low level IL-17. We observed rapid boosting of immune responses in M.tb-infected participants, suggesting natural infection acts as a prime to vaccination.

Conclusions: The clinically acceptable safety and immunogenicity profile of M72/AS01E in adolescents living in an area with high TB burden support the move to efficacy trials.

Keywords: Cytokine; M72/AS01(E); NK cell; T cell; Tuberculosis; Vaccine.


Figures

Fig. 1
Fig. 1
M72/AS01E induces a robust CD4 T cell response that is boosted with a second vaccination. Longitudinal CD4 T cell responses to pooled M72 peptides in whole blood (A and B) and cryopreserved PBMC (C) from individual participants. (A) Total cytokine responses were calculated as the frequencies of CD4 T cells expressing any of IFN-γ, IL-2, TNF-α and/or IL-17. Each line represents a different individual in either the M72/AS01E vaccinated (n = 40, in red) or placebo vaccinated group (n = 19, in blue). Arrows represent the time of vaccination. Results are shown after background subtraction of frequencies of cytokine-expressing CD4 T cells in the unstimulated negative control sample. Wilcoxon matched pairs signed rank test was used to compare frequencies of M72-specific total cytokine response between two time points. Wilcoxon matched pairs signed rank test p values are shown, compared to pre-vaccination time point. (B) Vaccination induced a complex profile of cytokine expression and multiple distinct subsets of CD4 T cell responses. Frequencies of M72-specific CD4 T cells expressing IFN-γ, IL-2, TNF-α and IL-17 were measured by ICS assay after 12 h stimulation of whole blood with M72 peptide pools. For each plot, only the M72/AS01E vaccinated participants are shown. The median is represented by the horizontal line, the interquartile range by the box and the range by the whiskers. Durability of response of each subset of CD4 T cell population was measured by Wilcoxon matched-pairs signed rank test comparing Day 210 to pre-vaccination responses; only values <0.05 are shown. Representative flow cytometry plots and gating strategy are shown in Supplementary Fig. S2. (C) Frequencies of CD4 T cells expressing IL-2, TNF-α, IFN-γ and CD40L in response to M72 peptide pool stimulation measured in cryopreserved PBMC by ICS. For B and C, only the M72/AS01E vaccinated participants are shown. Results are shown after background subtraction of cytokine production in the unstimulated control. (For interpretation of the references to color in this figure legend, the reader is referred to the web version of this article.)
Fig. 2
Fig. 2
M72/AS01E induces a sustained CD8 T cell response. Longitudinal CD8 T cell responses to pooled M72 peptides in whole blood (A and B) and cryopreserved PBMC (C) from individual participants. (A) Total cytokine responses were calculated as the frequencies of CD8 T cells expressing any of IFN-γ, IL-2, TNF-α and/or IL-17. Each line represents a different individual in either the M72/AS01E vaccinated (n = 40, red) or placebo-vaccinated group (n = 19, blue). Arrows represent the time of vaccination. Results are shown after background subtraction of frequencies of cytokine-expressing CD8 T cells in the unstimulated negative control sample. Wilcoxon matched pairs signed rank test was used to compare frequency of M72-specific total cytokine response between two time points. Wilcoxon matched pairs signed rank test p values are shown after adjustment for multiple comparisons, compared to pre-vaccination time point. Friedman test was used to calculate significant differences across time. (B) Frequencies of M72-specific CD8 T cells expressing IFN-γ, IL-2, TNF-α and IL-17 measured by ICS assay after stimulation of whole blood with M72 peptide pools. For each plot, only M72/AS01E vaccinated participants are shown. The median, interquartile range and range are shown. Durability of response of each CD8 T cell subset was measured by Wilcoxon matched-pairs signed rank test comparing Day 210 to pre-vaccination responses; only values <0.05 are shown. (C) Frequencies of CD8 T cells expressing IL-2, TNF-α, IFN-γ and CD40L in response to M72 peptide pool stimulation measured in cryopreserved PBMC by ICS. For B and C, only the M72/AS01E vaccinated participants are shown. Results are shown after background subtraction of cytokine production in the unstimulated control. No subsets showed any significance in expression between Day 0 and Day 210 in the PBMC assay when performing Wilcoxon matched pairs signed rank test. (For interpretation of the references to color in this figure legend, the reader is referred to the web version of this article.)
Fig. 3
Fig. 3
Vaccination with M72/AS01E activates NK cells. IFN-γ production by activated CD69+CD56+ NK cells assessed in cryopreserved PBMC in response to 18 h M72 peptide pool stimulation. Frequencies of IFN-γ producing cells measured in CD16 (A) and CD16+ (B) NK cells at the pre-vaccination time point (Day 0) and 7 days post first vaccination (Day 7) and second vaccination (Day 37), from placebo vaccinated (blue) and M72/AS01E vaccinated participants (red). Wilcoxon matched pairs signed rank test p values are shown. The Kruskal–Wallis test was used to compare all time points, and Wilcoxon matched pairs signed rank test used to compare each time point to Day 0. Correlation is shown between IL-2 production by M72-specific CD4 T cells in PBMC and IFN-γ expressing CD56+CD16CD69+ NK cells (C) and CD56+CD16+CD69+ NK cells (D). Spearman correlation p and r values are shown, comparing correlation at Day 0 (red circles), Day 7 (yellow squares) and Day 37 (blue triangles). (For interpretation of the references to color in this figure legend, the reader is referred to the web version of this article.)
Fig. 4
Fig. 4
M72/AS01E induces an antibody response. Geometric mean concentrations (GMC) of anti-M72 IgG antibodies measured by ELISA in serially diluted serum from placebo (blue) and M72-vaccinated participants (red). The Friedman test was used to compare all time points, and Wilcoxon matched pairs signed rank test used to compare each time point to Day 0.
Fig. 5
Fig. 5
M72/AS01E induces a higher response in individuals already exposed to M.tb. (A) Median total CD4 (left) and CD8 (right) M72-specifc T cell responses in whole blood are shown in M72/AS01E vaccinated adolescents stratified according to their M.tb infection status using the QuantiFERON-TB Gold In-Tube test. Bars represent interquartile range. Background values (unstimulated) were subtracted. For all analyses, a Mann–Whitney U test was performed to compare the response of each group at specific time points post-vaccination. Closed squares (purple) represent M.tb-infected (QFT-positive) individuals and open squares (green) represent M.tb-uninfected (QFT-negative) individuals. (B) Pie charts representing the median proportion of cells co-expressing cytokines, among all M72-specific CD4 and CD8 T cells expressing cytokines, after whole blood stimulation with M72 peptide pool. A Mann–Whitney test was performed to compare the proportion (%) of CD4 T cells expressing 3 or more cytokines, and CD8 T cells expressing 2 or more cytokines. Only p values <0.05 are shown. (C) IFN-γ response in CD56+CD16 (left) and CD56+CD16+ (right) CD69+ activated NK cells are shown for QFT-positive and QFT-negative individuals. Median and interquartile ranges are shown. Mann–Whitney p values comparing QFT-negative and QFT-positive participants at each time point are shown. (D) IFN-γ production by CD56+CD16 (left) and CD56+CD16+ (right) activated NK cells at day 37 associated with M72-specific CD4 T-cells expressing IL-2 among the QFT-positive participants. Data are reported as the association between frequencies of CD4 T cells producing IL-2 and frequencies of activated NK cells producing IFNγ after M72 peptide pool stimulation, in QFT-positive and QFT-negative participants vaccinated with M72/AS01E. A cut-off for the proportion of cytokine producing cells, shown by dotted lines, was established based on the 95th percentile observed in pre-vaccination samples from all vaccinated participants. The number of QFT-negative and QFT-positive (shaded) participants in each quadrant at each study day is indicated. At study days 0, 7 and 37, the number of QFT-positive M72/AS01E vaccinated participants with samples available was n = 11, 11 and 10, respectively, and the number of QFT-negative M72/AS01E vaccinated participants with samples available was n = 12, 9 and 8, respectively. (E) Antibody response kinetics to M72 in QFT-negative and QFT-positive individuals after one or two immunizations of M72/AS01E. Median and interquartile ranges of anti-M72 GMC are shown. Mann–Whitney p value comparing QFT-negative and QFT-positive participants at each time point are shown. (For interpretation of the references to color in this figure legend, the reader is referred to the web version of this article.)

Similar articles

Cited by

References

    1. World Health Organization. Global tuberculosis report 2014. Geneva: World Health Organization; 2014.
    1. Soysal A, Millington KA, Bakir M, Dosanjh D, Aslan Y, Deeks JJ, et al. Effect of BCG vaccination on risk of Mycobacterium tuberculosis infection in children with household tuberculosis contact: a prospective community-based study. Lancet. 2005;366:1443–51. - PubMed
    1. Colditz GA, Brewer TF, Berkey CS, Wilson ME, Burdick E, Fineberg HV, et al. Efficacy of BCG vaccine in the prevention of tuberculosis. Meta-analysis of the published literature. J Am Med Assoc. 1994;271:698–702. - PubMed
    1. Mangtani P, Abubakar I, Ariti C, Beynon R, Pimpin L, Fine PEM, et al. Protection by BCG vaccine against tuberculosis: a systematic review of randomized controlled trials. Clin Infect Dis. 2014;58:470–80. - PubMed
    1. Trunz BB, Fine P, Dye C. Effect of BCG vaccination on childhood tuberculous meningitis and miliary tuberculosis worldwide: a meta-analysis and assessment of cost-effectiveness. Lancet. 2006;367:1173–80. - PubMed

Publication types

MeSH terms

Associated data