

Dynamic changes of RNA-sequencing expression for precision medicine: N-of-1-pathways Mahalanobis distance within pathways of single subjects predicts breast cancer survival
- PMID: 26072495
- PMCID: PMC4765863
- DOI: 10.1093/bioinformatics/btv253
Dynamic changes of RNA-sequencing expression for precision medicine: N-of-1-pathways Mahalanobis distance within pathways of single subjects predicts breast cancer survival
Abstract
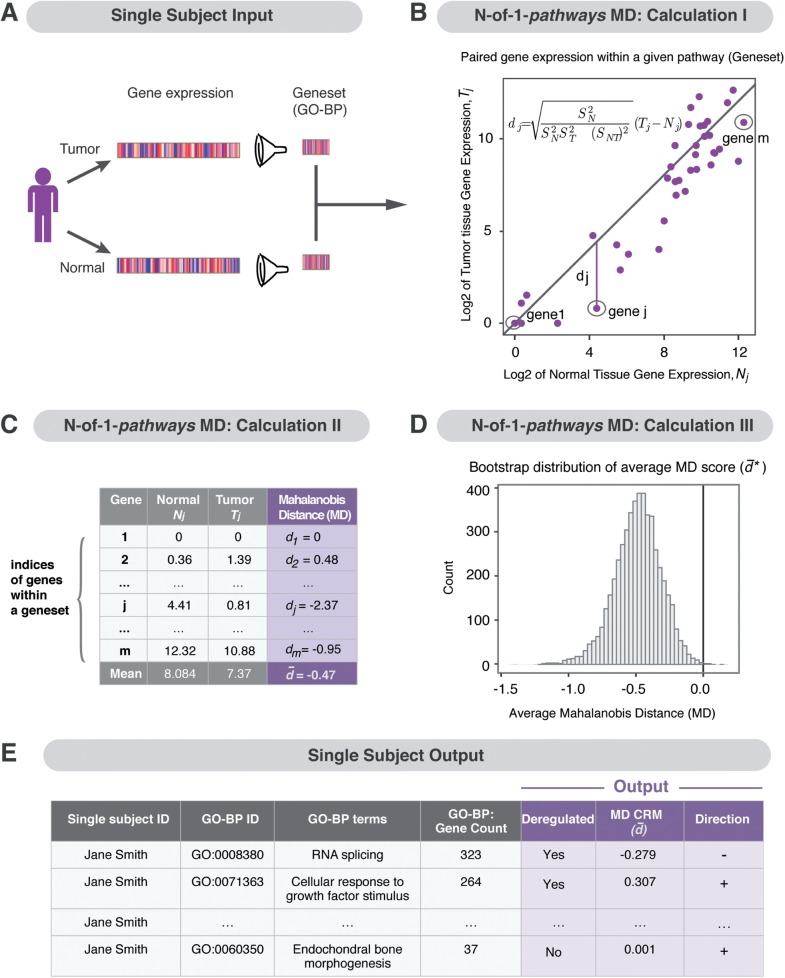
Motivation: The conventional approach to personalized medicine relies on molecular data analytics across multiple patients. The path to precision medicine lies with molecular data analytics that can discover interpretable single-subject signals (N-of-1). We developed a global framework, N-of-1-pathways, for a mechanistic-anchored approach to single-subject gene expression data analysis. We previously employed a metric that could prioritize the statistical significance of a deregulated pathway in single subjects, however, it lacked in quantitative interpretability (e.g. the equivalent to a gene expression fold-change).
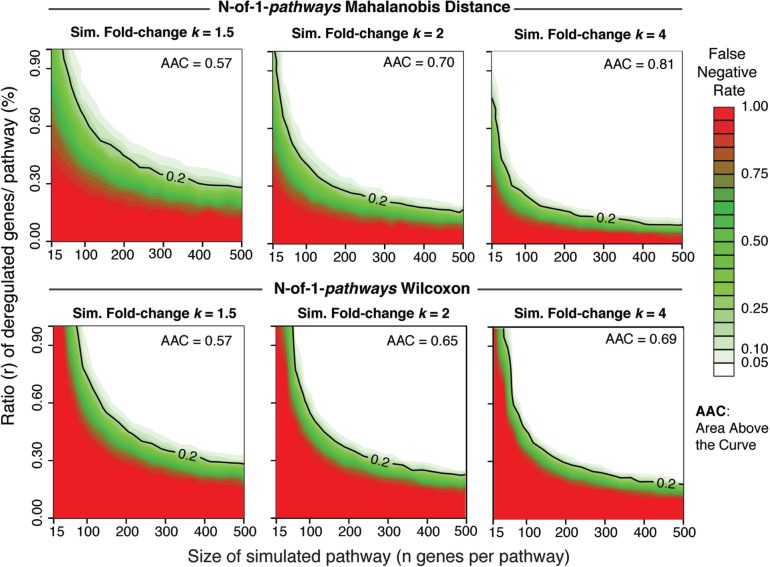
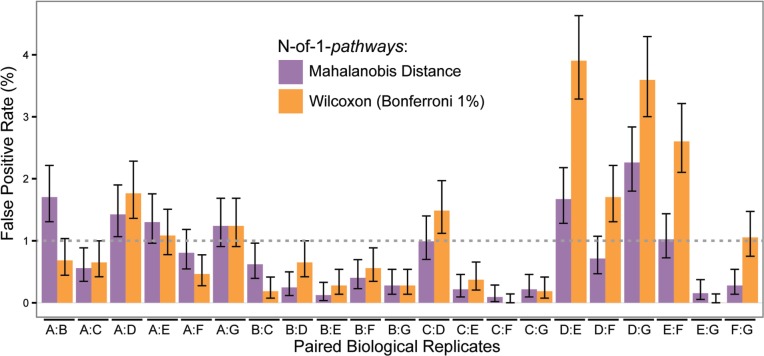
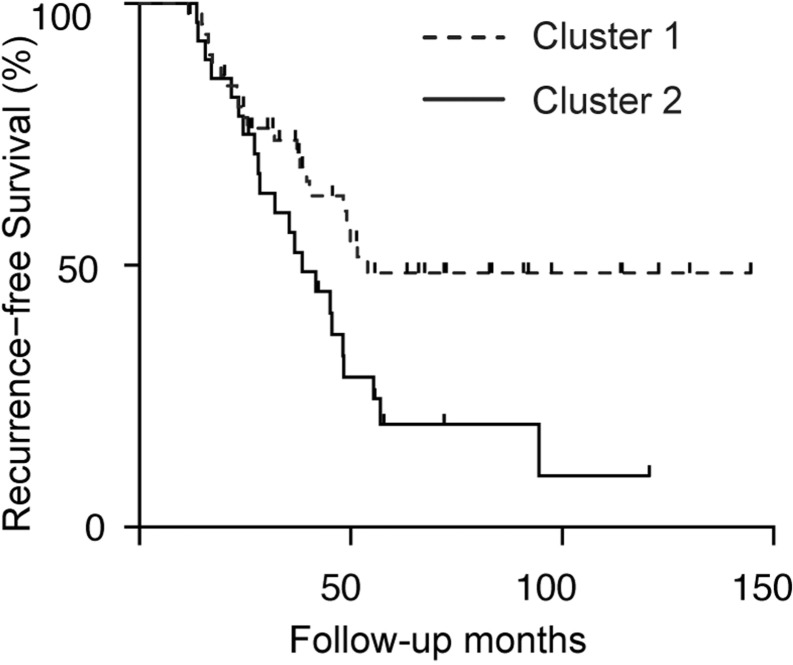
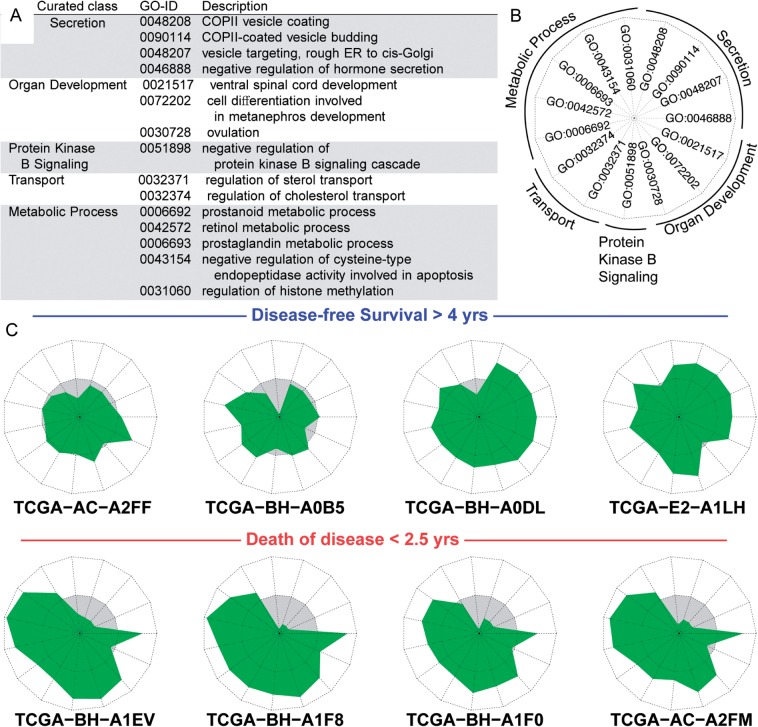
Results: In this study, we extend our previous approach with the application of statistical Mahalanobis distance (MD) to quantify personal pathway-level deregulation. We demonstrate that this approach, N-of-1-pathways Paired Samples MD (N-OF-1-PATHWAYS-MD), detects deregulated pathways (empirical simulations), while not inflating false-positive rate using a study with biological replicates. Finally, we establish that N-OF-1-PATHWAYS-MD scores are, biologically significant, clinically relevant and are predictive of breast cancer survival (P < 0.05, n = 80 invasive carcinoma; TCGA RNA-sequences).
Conclusion: N-of-1-pathways MD provides a practical approach towards precision medicine. The method generates the magnitude and the biological significance of personal deregulated pathways results derived solely from the patient's transcriptome. These pathways offer the opportunities for deriving clinically actionable decisions that have the potential to complement the clinical interpretability of personal polymorphisms obtained from DNA acquired or inherited polymorphisms and mutations. In addition, it offers an opportunity for applicability to diseases in which DNA changes may not be relevant, and thus expand the 'interpretable 'omics' of single subjects (e.g. personalome).
Availability and implementation: http://www.lussierlab.net/publications/N-of-1-pathways.
© The Author 2015. Published by Oxford University Press.
Figures
Similar articles
-
Analysis of aggregated cell-cell statistical distances within pathways unveils therapeutic-resistance mechanisms in circulating tumor cells.Bioinformatics. 2016 Jun 15;32(12):i80-i89. doi: 10.1093/bioinformatics/btw248. Bioinformatics. 2016. PMID: 27307648 Free PMC article.
-
'N-of-1-pathways' unveils personal deregulated mechanisms from a single pair of RNA-Seq samples: towards precision medicine.J Am Med Inform Assoc. 2014 Nov-Dec;21(6):1015-25. doi: 10.1136/amiajnl-2013-002519. Epub 2014 Jun 12. J Am Med Inform Assoc. 2014. PMID: 25301808 Free PMC article.
-
kMEn: Analyzing noisy and bidirectional transcriptional pathway responses in single subjects.J Biomed Inform. 2017 Feb;66:32-41. doi: 10.1016/j.jbi.2016.12.009. Epub 2016 Dec 19. J Biomed Inform. 2017. PMID: 28007582 Free PMC article.
-
Developing a 'personalome' for precision medicine: emerging methods that compute interpretable effect sizes from single-subject transcriptomes.Brief Bioinform. 2019 May 21;20(3):789-805. doi: 10.1093/bib/bbx149. Brief Bioinform. 2019. PMID: 29272327 Free PMC article. Review.
-
High-throughput «Omics» technologies: New tools for the study of triple-negative breast cancer.Cancer Lett. 2016 Nov 1;382(1):77-85. doi: 10.1016/j.canlet.2016.03.001. Epub 2016 Mar 7. Cancer Lett. 2016. PMID: 26965997 Review.
Cited by
-
Personalized beyond Precision: Designing Unbiased Gold Standards to Improve Single-Subject Studies of Personal Genome Dynamics from Gene Products.J Pers Med. 2020 Dec 31;11(1):24. doi: 10.3390/jpm11010024. J Pers Med. 2020. PMID: 33396440 Free PMC article.
-
A Single-Subject Method to Detect Pathways Enriched With Alternatively Spliced Genes.Front Genet. 2019 May 9;10:414. doi: 10.3389/fgene.2019.00414. eCollection 2019. Front Genet. 2019. PMID: 31143202 Free PMC article.
-
N-of-1-pathways MixEnrich: advancing precision medicine via single-subject analysis in discovering dynamic changes of transcriptomes.BMC Med Genomics. 2017 May 24;10(Suppl 1):27. doi: 10.1186/s12920-017-0263-4. BMC Med Genomics. 2017. PMID: 28589853 Free PMC article.
-
Analysis of aggregated cell-cell statistical distances within pathways unveils therapeutic-resistance mechanisms in circulating tumor cells.Bioinformatics. 2016 Jun 15;32(12):i80-i89. doi: 10.1093/bioinformatics/btw248. Bioinformatics. 2016. PMID: 27307648 Free PMC article.
-
DREAMSeq: An Improved Method for Analyzing Differentially Expressed Genes in RNA-seq Data.Front Genet. 2018 Nov 30;9:588. doi: 10.3389/fgene.2018.00588. eCollection 2018. Front Genet. 2018. PMID: 30559761 Free PMC article.
References
-
- Brown L.D., et al. (2001) Interval estimation for a binomial proportion. Stat. Sci., 16, 101–117.
-
- Chernick,M.R. (2008) Bootstrap Methods: A Guide for Practitioners and Researchers. John Wiley & Sons, Hoboken, New Jersey.
-
- Dillies M.-A., et al. (2013) A comprehensive evaluation of normalization methods for Illumina high-throughput RNA sequencing data analysis. Brief. Bioinform., 14, 671–683. - PubMed
Publication types
MeSH terms
LinkOut - more resources
Full Text Sources
Other Literature Sources
Medical
Research Materials
