. 2015 Jun 15;31(12):i53-61.
doi: 10.1093/bioinformatics/btv238.

IgRepertoireConstructor: a novel algorithm for antibody repertoire construction and immunoproteogenomics analysis

Affiliations

IgRepertoireConstructor: a novel algorithm for antibody repertoire construction and immunoproteogenomics analysis

Yana Safonova et al. Bioinformatics. .

Abstract

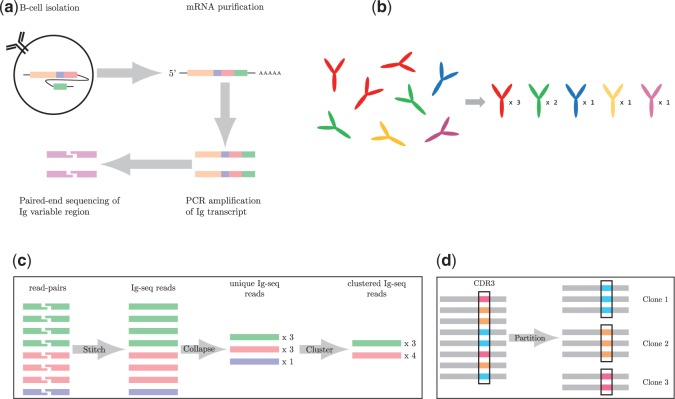
The analysis of concentrations of circulating antibodies in serum (antibody repertoire) is a fundamental, yet poorly studied, problem in immunoinformatics. The two current approaches to the analysis of antibody repertoires [next generation sequencing (NGS) and mass spectrometry (MS)] present difficult computational challenges since antibodies are not directly encoded in the germline but are extensively diversified by somatic recombination and hypermutations. Therefore, the protein database required for the interpretation of spectra from circulating antibodies is custom for each individual. Although such a database can be constructed via NGS, the reads generated by NGS are error-prone and even a single nucleotide error precludes identification of a peptide by the standard proteomics tools. Here, we present the IgRepertoireConstructor algorithm that performs error-correction of immunosequencing reads and uses mass spectra to validate the constructed antibody repertoires.

Availability and implementation: IgRepertoireConstructor is open source and freely available as a C++ and Python program running on all Unix-compatible platforms. The source code is available from http://bioinf.spbau.ru/igtools.

Contact: ppevzner@ucsd.edu

Supplementary information: Supplementary data are available at Bioinformatics online.


Figures

Fig. 1.
Fig. 1.
(a) An overview of immunoglobulin (Ig-seq) sequencing. Briefly, B-cells are isolated; transcripts are purified; antibody chains are amplified by PCR; and finally, paired-end sequencing of the Ig variable region is performed on the amplified Ig transcript molecules. (b) An antibody repertoire containing five different antibodies (shown on the left) is characterized by a set of pairs <sequence, abundance > (shown on the right). For example, the abundance of the ‘red’ antibody is 3. (c) The varying levels of sequence information. First, the paired reads are stitched together to form contiguous reads. These reads are then compressed to unique reads with count information, and finally clustered reads. E.g. the red and blue unique reads (with counts 3 and 1) are clustered into a single cluster with count 4 because they represent reads (with errors) derived from the same antibody. (d) Reads are partitioned according to identical CDR3 sequences (shown in the black rectangles). Each resulting cluster of antibodies is referred to as a clone
Fig. 2.
Fig. 2.
(a) A connected component with 107 vertices and 1426 edges in the Bounded Hamming graph with τ = 3 (fill-in is 0.25). The sizes of vertices are proportional to their degrees. (b) Clusters constructed as result of vertex decomposition of the Bounded Hamming Graph. Vertices of the same colors define the dense subgraphs in the decomposition [the colors are coordinated with Fig. 3 (bottom right)]. IgRepertoireConstructor constructs 42 clusters but 35 of them are trivial, i.e. are induced by a single read. Sizes and edge fill-ins (in brackets) of the remaining seven non-trivial clusters are: 2 (1.0), 3 (1.0), 6 (1.0), 8 (1.0), 12 (1.0), 18 (0.9) and 23 (0.9)
Fig. 3.
Fig. 3.
Construction of the antibody repertoire based on the decomposition of the Bounded Hamming Graph into dense subgraphs. (Top left) The adjacency matrix of the Bounded Hamming Graph shown in Figure 2a. Each element in the matrix corresponds to a pair of vertices x and y and is colored green if the edge (x, y) is presented in the graph. (Top right) Decomposition of the Bounded Hamming Graph into dense subgraphs (highlighted by different colors). Edges connecting vertices from different dense subgraph are colored in grey. (Bottom left) The adjacency matrix with edges corresponding to SHM-triggering patterns RGYW/WRCY highlighted in orange. (Bottom right) The final decomposition of the Bounded Hamming Graph takes into account the multiple alignment of reads corresponding to the same subgraph in the decomposition and breaks the large yellow subgraph (top right subfigure) into two smaller subgraphs highlighted in yellow and blue. The multiple alignment of ‘yellow’ and ‘blue’ reads from these smaller subgraphs is shown on the right (limited to positions 52–100). Note that all ‘yellow’ reads are similar to each other and all ‘blue’ reads are similar to each other (the differences are highlighted in red and likely represent sequencing errors). However, there exists a systematic difference (C/G mismatch within RGYW pattern in CDR1 region) between ‘yellow’ and ‘blue’ reads that allows IgRepertoireConstructor to split the large yellow subgraph in top right subfigure
Fig. 4.
Fig. 4.
(a) Distribution of exclusivity scores of antibodies. (b) PSM coverage along positions of each cluster. Positions of CDR1, CDR2 and CDR3 shown in gray as determined for a single cluster. Coverage is normalized for shared peptides using their exclusivity scores. (c) Origin of identified peptides. For each identified peptide, a representative cluster sequence was used to determine from which reference segment it originated; V, D or J. Each peptide is classified as V-, D- or J-peptide depending on whether it overlaps with segments marked as V, D or J regions for the heavy chain sequence (peptides spanning more than one region, e.g. V and J, are classified as both V-peptides and J-peptides)

References

    1. Arnaout R., et al. . (2011) High-resolution description of antibody heavy-chain repertoires in humans. PloS One, 6, e22365. - PMC - PubMed
    1. Bandeira N., et al. . (2008) Automated de novo protein sequencing of monoclonal antibodies. Nat. Biotechnol., 26, 1336–1338. - PMC - PubMed
    1. Bankevich A., et al. . (2012) SPAdes: a new genome assembly algorithm and its applications to single-cell sequencing. J. Comput. Biol., 19, 455–477. - PMC - PubMed
    1. Ben-Dor A., et al. . (1999) Clustering gene expression patterns. J. Comp. Biol., 6, 281–297. - PubMed
    1. Bonissone S., Pevzner P.A. (2015) Immunoglobulin Classification Using the Colored Antibody Graph. Lecture Notes in Computer Science, RECOMB 2015, Springer International Publishing, pp. 44–59. - PMC - PubMed

Publication types