Review
. 2015 Jun;11(6):e1-120.
doi: 10.1016/j.jalz.2014.11.001.

2014 Update of the Alzheimer's Disease Neuroimaging Initiative: A review of papers published since its inception

Affiliations
Review

2014 Update of the Alzheimer's Disease Neuroimaging Initiative: A review of papers published since its inception

Michael W Weiner et al. Alzheimers Dement. 2015 Jun.

Abstract

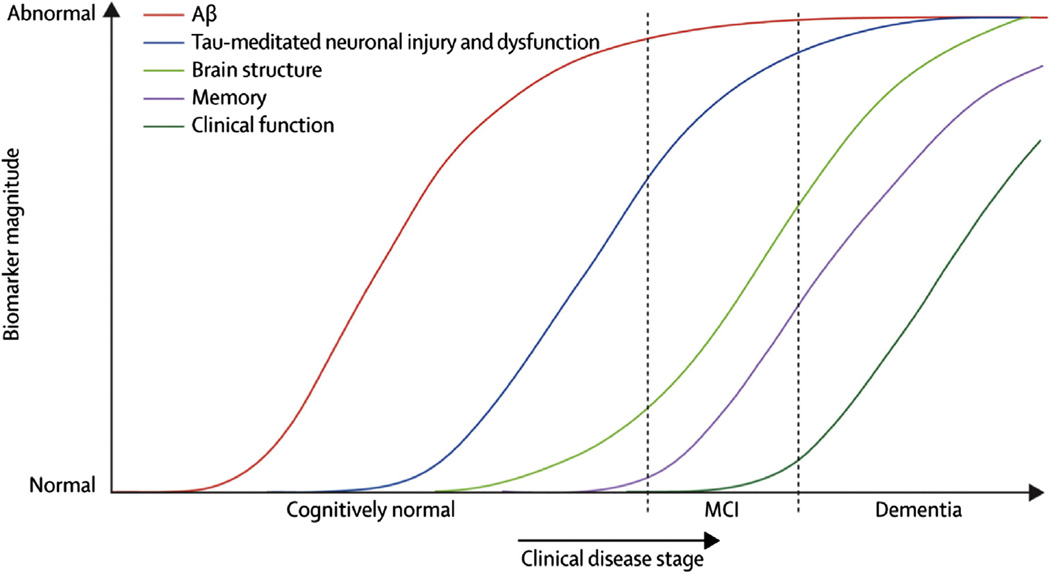
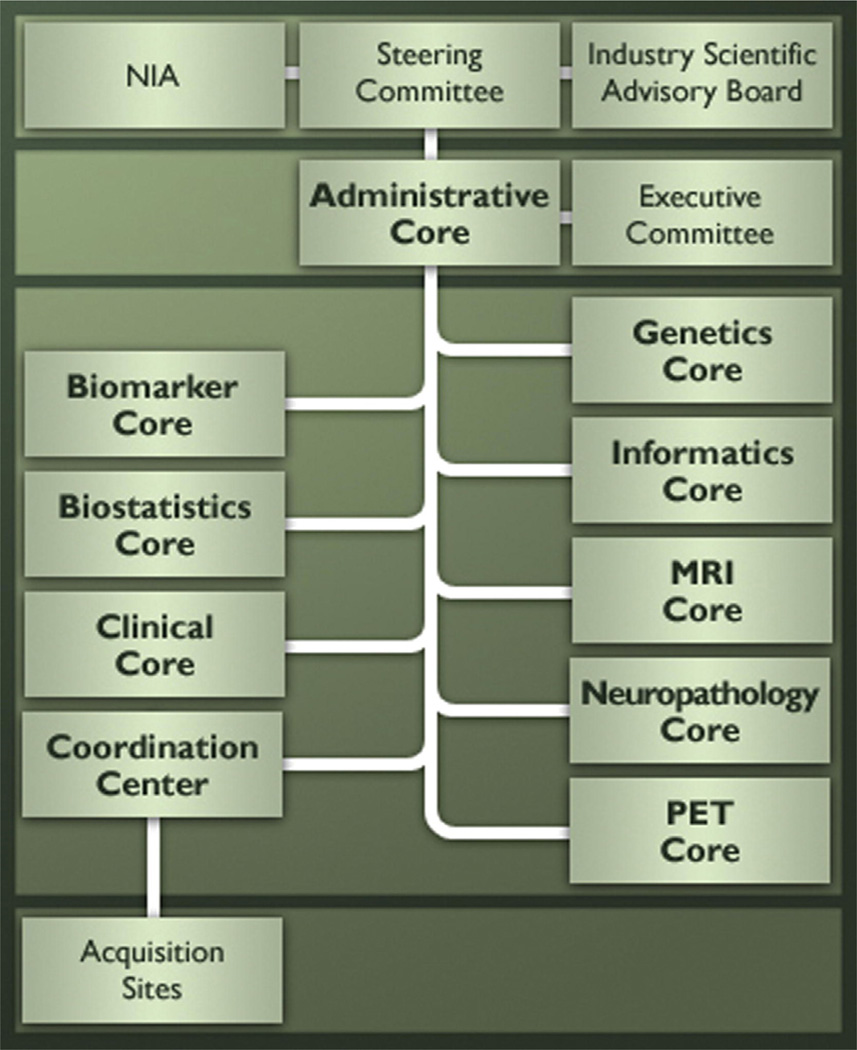
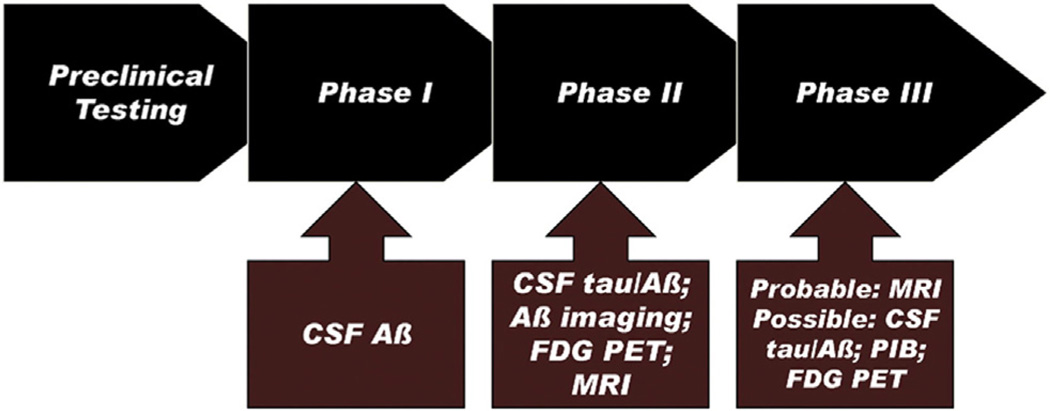
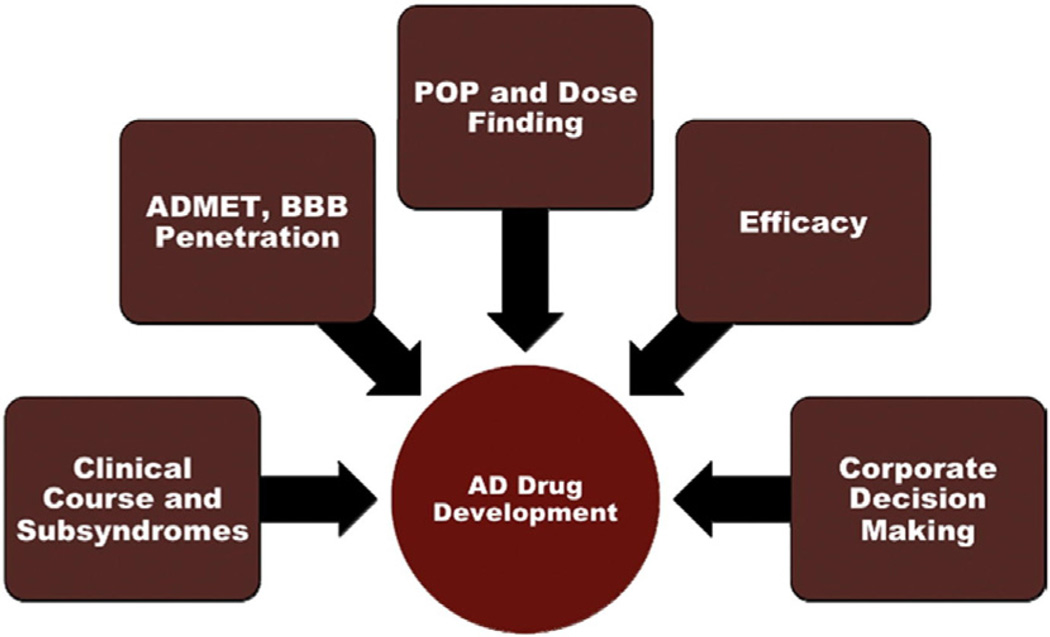
The Alzheimer's Disease Neuroimaging Initiative (ADNI) is an ongoing, longitudinal, multicenter study designed to develop clinical, imaging, genetic, and biochemical biomarkers for the early detection and tracking of Alzheimer's disease (AD). The initial study, ADNI-1, enrolled 400 subjects with early mild cognitive impairment (MCI), 200 with early AD, and 200 cognitively normal elderly controls. ADNI-1 was extended by a 2-year Grand Opportunities grant in 2009 and by a competitive renewal, ADNI-2, which enrolled an additional 550 participants and will run until 2015. This article reviews all papers published since the inception of the initiative and summarizes the results to the end of 2013. The major accomplishments of ADNI have been as follows: (1) the development of standardized methods for clinical tests, magnetic resonance imaging (MRI), positron emission tomography (PET), and cerebrospinal fluid (CSF) biomarkers in a multicenter setting; (2) elucidation of the patterns and rates of change of imaging and CSF biomarker measurements in control subjects, MCI patients, and AD patients. CSF biomarkers are largely consistent with disease trajectories predicted by β-amyloid cascade (Hardy, J Alzheimer's Dis 2006;9(Suppl 3):151-3) and tau-mediated neurodegeneration hypotheses for AD, whereas brain atrophy and hypometabolism levels show predicted patterns but exhibit differing rates of change depending on region and disease severity; (3) the assessment of alternative methods of diagnostic categorization. Currently, the best classifiers select and combine optimum features from multiple modalities, including MRI, [(18)F]-fluorodeoxyglucose-PET, amyloid PET, CSF biomarkers, and clinical tests; (4) the development of blood biomarkers for AD as potentially noninvasive and low-cost alternatives to CSF biomarkers for AD diagnosis and the assessment of α-syn as an additional biomarker; (5) the development of methods for the early detection of AD. CSF biomarkers, β-amyloid 42 and tau, as well as amyloid PET may reflect the earliest steps in AD pathology in mildly symptomatic or even nonsymptomatic subjects and are leading candidates for the detection of AD in its preclinical stages; (6) the improvement of clinical trial efficiency through the identification of subjects most likely to undergo imminent future clinical decline and the use of more sensitive outcome measures to reduce sample sizes. Multimodal methods incorporating APOE status and longitudinal MRI proved most highly predictive of future decline. Refinements of clinical tests used as outcome measures such as clinical dementia rating-sum of boxes further reduced sample sizes; (7) the pioneering of genome-wide association studies that leverage quantitative imaging and biomarker phenotypes, including longitudinal data, to confirm recently identified loci, CR1, CLU, and PICALM and to identify novel AD risk loci; (8) worldwide impact through the establishment of ADNI-like programs in Japan, Australia, Argentina, Taiwan, China, Korea, Europe, and Italy; (9) understanding the biology and pathobiology of normal aging, MCI, and AD through integration of ADNI biomarker and clinical data to stimulate research that will resolve controversies about competing hypotheses on the etiopathogenesis of AD, thereby advancing efforts to find disease-modifying drugs for AD; and (10) the establishment of infrastructure to allow sharing of all raw and processed data without embargo to interested scientific investigators throughout the world.

Keywords: Alzheimer's disease; Amyloid; Biomarker; Mild cognitive impairment; Tau.


Conflict of interest statement

Disclosures

Dallas P. Veitch has no conflicts to report.

Robert C. Green has no conflicts of interest to report.

Danielle Harvey has no conflicts of interest to report.

Judith A. Siuciak has no conflicts of interest to report.

Arthur W. Toga has no conflicts of interest to report.

Figures

Fig. 1
Fig. 1
Generation of soluble β-amyloid (Aβ) fragments from amyloid precursor protein. Reproduced with permission from Ref [7].
Fig. 2
Fig. 2
Model for Alzheimer’s disease (AD) progression. Reproduced with permission from Ref [14].
Fig. 3
Fig. 3
Alzheimer’s Disease Neuroimaging Initiative (ADNI) structure and organization.
Fig. 4
Fig. 4
AD drug development. Black arrows show the phases of drug development; the brick-colored arrows show the ADNI biomarkers that could be used in that stage. Reproduced with permission from Ref [37].
Fig. 5
Fig. 5
Roles of biomarkers in AD drug development. Abbreviations: AD-MET, absorption, distribution, metabolism, excretion, toxicity; BBB, blood–brain barrier; POP, proof of principle. Reproduced with permission from Ref [37].
Fig. 6
Fig. 6
Steps of multiatlas segmentation. (I) nonrigid registration used to register all atlases to patient data, (II) classifier fusion using majority voting for producing class labels for all voxels, and (III) postprocessing of multiatlas segmentation result by various algorithms, taking into account intensity distributions of different structures. Reproduced with permission from Ref [61].
Fig. 7
Fig. 7
Group differences in average thickness (mm) for left hemisphere. Top row: NC vs. SMCI; middle row: normal controls (NC) vs. MMCI; bottom row: NC vs. AD. Left mesial views, right lateral views. The scale ranges from < −0.3 (yellow) to > +0.3 (cyan) mm thickness. Areas on the red-yellow spectrum indicate regions of thinning with disease: approximate color scale in mm is −0.05 to −0.15 dark red, −0.20 bright red, −0.25 orange, and < −0.30 yellow. For thicker regions: +0.05 to +0.15 blue. Any differences smaller than ± 0.05 mm are gray. Reproduced with permission from Ref [109].
Fig. 8
Fig. 8
Annual atrophy rates as a function of degree of clinical impairment. Clinical impairment measured using baseline clinical dementia rating-sum of boxes (CDR-SB) scores. Mean atrophy rates are represented as a percent change in neocortical volume and mapped onto the lateral (left), ventral (middle), and medial (right) pial surface of the left hemisphere. These data demonstrate that atrophy rates are most prominent in posterior brain regions early in the course of disease, spreading to anterior regions as the level of impairment increases, with relative sparing of sensorimotor regions. Reproduced with permission from Ref [111].
Fig. 9
Fig. 9
Distribution of atrophy scores used to classify subjects with MCI. MCI atrophy score was derived from LONI data archive trained on data from all control subjects and subjects with AD. Discriminant model assumed equal prior group probabilities. Individuals were classified as having control phenotype if their scores were above −0.33. Cutoff score was chosen to maximize overall accuracy of classifying control subjects and subjects with AD on whom this model was trained. Average atrophy score for subjects with MCI was −0.50. Atrophy score is not normally distributed (Kolmogorov–Smirnov test = 0.73, df = 175, P =.025) but shows evidence of bimodal distribution. Reproduced with permission from Ref [117].
Fig. 10
Fig. 10
Individual trajectories of hippocampal volume change. Thick black lines indicate the mean trajectory change of each group. Reproduced with permission from Ref [121].
Fig. 11
Fig. 11
Group differences in regional shape deformations. Abbreviations: Am, amygdala; Hp, hippocampus; V, ventricles; iLV, inferior lateral ventricles; Cd, caudate; Pu, putamen; Pa, globus pallidus; Th, thalamus. Reproduced with permission from Ref [122].
Fig. 12
Fig. 12
Cumulative distribution function (CDF) plots for voxelwise correlation of progressive temporal lobe tissue loss in MCI, AD, and pooled groups. (A) Correlations with various biomarker indices, including Aβ-42 (AB142), tau protein (TAU), phosphorylated-tau 181 (PTAU), tau/Aβ-42 ratio (TAUAB), and p-tau/Aβ-42 ratio (PTAUAB), and (B) correlations with various clinical measures. Reproduced with permission from Ref [113].
Fig. 13
Fig. 13
Apolipoprotein E (APOE) gene effects on regional brain volumes. Maps show the mean percent differences in regional brain volumes for four different group comparisons. Percent differences are displayed on models of the regions implicated: (A) ventricular cerebrospinal fluid (CSF), (B) sulcal CSF, (C) hippocampi, and (D) temporal lobes; dotted lines show the boundary of the hippocampus. Reproduced with permission from Ref [112].
Fig. 14
Fig. 14
Association of regional brain tissue volumes with body mass index. These represent the estimated degree of tissue excess or deficit at each voxel, as a percentage, for every unit increase in body mass index, after statistically controlling for the effects of age, sex, and education on brain structure. Images are in radiological convention (left side of the brain shown on the right) and are displayed on a specially constructed average brain template created from the subjects within each cohort (mean deformation template). Reproduced with permission from Ref [133].
Fig. 15
Fig. 15
The episodic memory network. Along with the hippocampal formation, the cortical areas shown here are part of the episodic memory network. Shown here are pial cortical representations of selected parcellations in the left hemisphere. From left to right: medial, ventral, and lateral views. Reproduced with permission from Ref [136].
Fig. 16
Fig. 16
Correlations between biomarker levels, structural abnormalities, and cognitive performance in APOE ε4 carriers and noncarriers. Smoothed biomarker (A and B) or STAND (C) z score curves plotted as a function of cognitive performance (Mini-Mental State Examination, MMSE). Abbreviation: STAND, Structural Abnormality Index. Reproduced with permission from Ref [128].
Fig. 17
Fig. 17
Biomarker trajectories through disease progression. For each biomarker, individual z scores are plotted against ADAS-cog (cognitive subscale of the Alzheimer’s Disease Assessment Scale) scores, and the fitted sigmoid curve is displayed. Full circles denote healthy control subjects, full squares MCI patients converted to AD, empty circles early AD, and full triangles late AD patients. Sigmoid fitting was better than linear fitting for tau, Aβ-42, and hippocampus (for the latter: sigmoid nonsignificantly better than linear); linear fitting was better for [18F]-fluorodeoxyglucose-positron emission tomography (FDG-PET). Reproduced with permission from Ref [153].
Fig. 18
Fig. 18
Separation of control, MCI, and AD subjects using a CSFAβ-42/t-tau mixed model signature. A combined CSFAβ-42/t-tau mixed model was applied to the subject groups. Densities of each signature are represented with confidence ellipses, and signature membership of the subject based on the mixture is indicated with the corresponding color (signature 1 is the AD signature [red]; signature 2 is the healthy signature [green]). Reproduced with permission from Ref [159].
Fig. 19
Fig. 19
Association between temporal lobe atrophy and conversion to AD. Subjects who converted from MCI to AD over a period of 1 year after their first scan were coded as “1”; nonconverters were coded as “0.” A negative correlation suggests that temporal lobe degeneration predicts future conversion to AD. Reproduced with permission from Ref [112].
Fig. 20
Fig. 20
Effect size of imaging biomarkers for MCI converters versus MCI nonconverters. Effect sizes (Cohen d) of the comparison between MCI stable (MCI nonconverter) and MCI converter groups evaluated for selected imaging biomarkers. Reproduced with permission from Ref [114].
Fig. 21
Fig. 21
Significance maps of correlation between ventricular shape and cognitive decline. Significance maps correlate baseline ventricular shape with subsequent decline, over the following year, in three commonly used clinical scores. Reproduced with permission from Ref [126].
Fig. 22
Fig. 22
Maps of associations with MMSE scores at baseline and 1 year later, MCI-to-AD conversion, and CSF concentrations of tau. Three-dimensional maps show areas of significant associations between local volumetric atrophy in the caudate and MMSE scores at baseline and after a 1-year follow-up interval, with P values color-coded at each surface voxel. Reproduced with permission from Ref [130].
Fig. 23
Fig. 23
Pittsburgh compound B-positron emission tomography (PiB-PET) and magnetic resonance imaging (MRI) comparisons of MCI converters versus MCI nonconverters. Left: MCI progressor. Top: positive PiB-PET. Bottom: MRI illustrating atrophic hippocampi and ventricular enlargement. Right: MCI nonprogressor. Top: negative PiB-PET with nonspecific white matter retention but no cortical retention. Bottom: MRI illustrating normal hippocampi and no ventricular enlargement. Reproduced with permission from Ref [152].
Fig. 24
Fig. 24
Mean biomarker levels (t-tau, p-tau, and Aβ-42) for the APOE genotype groups. The APOE ε2 carriers are represented in black, the ε3 homozygotes in gray, and the ε4 carriers in white. The CSF Aβ-42 levels show a significant stepwise trend downward, from APOE ε2 carriers to ε3 homozygotes to ε4 carriers, whereas the t-tau and the p-tau levels show the opposite trend. Reproduced with permission from Ref [208].
Fig. 25
Fig. 25
Worldwide ADNI sites. Abbreviations: NA-ADNI, North American ADNI; Arg-ADNI, Argentinean ADNI; E-ADNI, European ADNI; C-ADNI, Chinese ADNI; K-ADNI, Korean ADNI; J-ADNI, Japanese ADNI; T-ADNI, Taiwanese ADNI; A-ADNI, Australian ADNI.
Fig. 26
Fig. 26
Disease State Index values of a patient with subtle indication of AD (total DSI value = 0.56). The name of the test and DSI value is shown next to each node. Larger nodes discriminate better between healthy and diseased patients (visualization of relevance). ‘Hot,’ i.e., red, nodes highlights patient data that fits AD profile (visualization of DSI). Here, ADAS and MRI contribute most to the AD DSI, indicated by the largest node size. MRI variables, especially hippocampal volume, whose computation is depicted on the right hand side, push the total DSI value towards AD population. Reproduced with permission from Ref [252].
Fig. 27
Fig. 27
Simulated power for studies in MCI and MCI with amyloid dysregulation (MCI-Aβ) versus total sample size, n. Lines represent LOESS smooths. Abbreviation: PH, proportional hazard. Reproduced with permission from Ref [266].
Fig. 28
Fig. 28
Model illustrating the independent effect of cognitive reserve on the relationship between biomarkers of pathology and cognition in subjects with (A) low, (B), average and (C) high cognitive reserve. In (A) and (C), the levels of Aβ are indicated by a square and the levels of atrophy are indicated by a circle at the point where cognitively normal subjects progress to MCI. This illustrates that at an equivalent clinical diagnostic threshold, subjects with high cognitive reserve have greater biomarker abnormalities than those with low cognitive reserve. Reproduced with permission from Ref [278].
Fig. 29
Fig. 29
Box plots and superimposed data points showing the distribution of AD biomarkers by baseline diagnosis and visit. The dotted horizontal line extending across all box plots represents the cut point delineating normal from abnormal for each biomarker. Reproduced with permission from Ref [282].
Fig. 30
Fig. 30
(A) Expression of cortical signature of Alzheimer’s disease is associated with future cogntive decline. (B) Expression of cortical signature of Alzheimer’s disease is associated with AD-like spinal fluid. Reproduced with permission from Ref [139].
Fig. 31
Fig. 31
Box plot of baseline PET AD scores for diagnostic groups. AD patients and MCI patients progressing to AD have significantly higher scores than stable subjects (arrows in top insert, P < .05 in Tukey multiple comparisons). Abbreviation: C, control. Reproduced with permission from Ref [291].
Fig. 32
Fig. 32
A probabilistic hypercube. This can be interpreted as a geometrical representation of the output of a seat of classifiers, each one estimated with different types of data. The set of AD-PS scores corresponding to a given individual define a position inside the hypercube. The position of three individuals is illustrated. From Casanova et al [411]. Abbreviations: ADNI, Alzheimer’s Disease Neuroimaging Initiative; AD, Alzheimer’s Disease; CN, cognitively normal; GM, gray matter; WM, white matter.
Fig. 33
Fig. 33
Estimated trajectories of Aβ-42 (A) and p-tau181 (B) based on ADNI longitudinal data. The estimated time to reach the AD cut point threshold is indicated based on a model that includes all subjects (blue) or subjects with abnormal baseline values or changes during follow-up (red). From Toledo et al [434].
Fig. 34
Fig. 34
Suboptimal targeting of ADAS-cog. The distribution of person measurements (upper pink histogram) and the distribution of item locations of the 11 ADAS-cog components (lower blue histogram) are presented. From Hobart et al [474].
Fig. 35
Fig. 35
The effect of APOE ε 4 status on the β-amyloid PET standard uptake value ratio (SUVR) in four cortical regions across diagnostic categories. (−) APOE ε 4 negative; (+) APOE ε 4 positive. From Murphy et al [482]. Abbreviations: EMCI, early mild cognitive impairment; LMCI, late mild cognitive impairment; AD, Alzheimer’s disease.
Fig. 36
Fig. 36
(A) Estimated biomarker dynamics as a function of the ADPS score. (B) 90% Confidence intervals for the inflection point of each biomarker. From Jedynak et al [484]. Abbreviations: MMSE, Mini-Mental State Examination; CDR-SB, clinical dementia rating-sum of boxes; MCI, mild cognitive impairment; AD, Alzheimer’s disease.
Fig. 37
Fig. 37
The effect of accounting missing data on classification. In addition to the feature selection of an incomplete Multi-Source Feature (iMSF) learning method, the incomplete Source Feature Section (iSFS) model accounts for missing data. From Xiang et al [416]. Abbreviations: AUC, area under the curve; AD, Alzheimer’s disease; NC, normal control; MCI, mild cognitive impairment.
Fig. 38
Fig. 38
Flow charts showing the categorization of ADNI subjects with AD using the strict NIA-AA criteria (A) and Mayo-modified NIA-AA criteria (B). Abbreviations: AD, Alzheimer’s disease; ADNI, Alzheimer’s Disease Neuroimaging Initiative; FDG, fluorodeoxyglucose; MRI, magnetic resonance imaging; NIA-AA-C, National Institute on Aging-Alzheimer’s Association clinical diagnostic guidelines. From Lowe et al [354].
Fig. 39
Fig. 39
Contribution of white matter hyperintensities (WMHs) to AD. Proportion of subjects with MCI who converted to Alzheimer’s disease (AD) during the follow-up period as a function of β-amyloid deposition (PiB) and WMHs. From Provenzano et al [441].
Fig. 40
Fig. 40
The stability of different MRI features in predicting (A) ADAS-cog and (B) MMSE scores. MRI regions aligning with red in the stability vector most accurately predict cognitive scores. Several regions (e.g., cortical thickness averages of the left and right entorhinal, and left middle temporal, and hippocampal volume) predict ADAS-cog over 3 years, whereas most regions predict MMSE scores only over 6 to 12 months. From Zhou et al [407]. Abbreviations: MRI, magnetic resonance imaging; MMSE, Mini-Mental State Examination.
Fig. 41
Fig. 41
Application of the AD-conv score in the ADNI population. (A) Box plot of MCI converters and nonconverters; (B) ROC curves for MCIc versus MCInc; (C) distribution of probabilities among the stratified groups according to the AD-conv score. From Arbizu et al [397].
Fig. 42
Fig. 42
The effect of modeling disease onset time on hippocampal volume-time profiles. (A) Evolution of hippocampal volumes for each disease status. Disease onset times are shown with hippocampal volume (B) centered to the median of the normal population and (C) normalized for age and head size. From Delor et al [504]. Abbreviations: MCI, mild cognitive impairment; AD, Alzheimer’s disease.
Fig. 43
Fig. 43
Prediction accuracies, sensitivities, and specificities for individual and combined neuroimaging modalities. From Trzepacz et al [510]. Abbreviations: MRI, magnetic resonance imaging; FDG, fluorodeoxyglucose; SUVR, standard uptake value ratio; PET, positron emission tomography.
Fig. 44
Fig. 44
Enrichment strategies for the selection of MCI participants for clinical trials. Estimated N80s are indicated assuming a 24-month trial with scans every 6 months. From Holland et al [516]. Abbreviations: MCI, mild cognitive impairment; MRI, magnetic resonance imaging; CDR-SB, clinical dementia rating-sum of boxes.
Fig. 45
Fig. 45
Genetic approaches used with ADNI data. From Shen et al [521]. Abbreviation: ROI, region of interest.
Fig. 46
Fig. 46
Gene-gene interaction networks for (A) entorhinal atrophy and (B) hippocampal atrophy. Each circle is a gene that participated in a significant SNP-SNP interaction model. Circles colored orange are genes previously identified as a possible AD risk gene. From Meda et al [529].
Fig. 47
Fig. 47
Involvement of genes of interest identified from pathways enriched in memory impairment in a transcriptional regulation network centered on SP1. From Ramanan et al [471].

References

    1. Hardy J. Alzheimer’s disease: the amyloid cascade hypothesis: an update and reappraisal. J Alzheimers Dis. 2006;9(Suppl 3):151–153. - PubMed
    1. Mueller SG, Weiner MW, Thal LJ, Petersen RC, Jack C, Jagust W, et al. The Alzheimer’s disease neuroimaging initiative. Neuroimaging Clin N Am. 2005;15:869–877. xi–xii. - PMC - PubMed
    1. Weiner MW, Aisen PS, Jack CR, Jr, Jagust WJ, Trojanowski JQ, Shaw L, et al. The Alzheimer’s Disease Neuroimaging Initiative: progress report and future plans. Alzheimers Dement. 2010;6:202.e7–211.e7. - PMC - PubMed
    1. Frisoni GB, Weiner MW. Alzheimer’s disease neuroimaging initiative special issue. Neurobiol Aging. 2010;31:1259–1262. - PubMed
    1. Petersen RC, Roberts RO, Knopman DS, Boeve BF, Geda YE, Ivnik RJ, et al. Mild cognitive impairment: ten years later. Arch Neurol. 2009;66:1447–1455. - PMC - PubMed

Appendix

1 Publications arising from AIBL
1.1 AIBL Publication list, 2009–present
1.1.1 2009
    1. Bourgeat P, Chetelat G, Villemagne VL, Fripp J, Raniga P, Acosta O, et al. B-amyloid burden in the temporal neocortex is related to hippocampal atrophy in elderly subjects without dementia. Neurology. 2010;74:121–127. - PubMed
    1. Ellis KA, Bush AI, Darby D, De Fazio D, Foster J, Hudson P, et al. The Australian Imaging, Biomarkers and Lifestyle (AIBL) study of aging: methodology and baseline characteristics of 1112 individuals recruited for a longitudinal study of Alzheimer’s disease. Int Psychogeriatr. 2009;21:672–687. - PubMed
    1. Fodero-Tavoletti MT, Cappai R, McLean CA, Pike KE, Adlard PA, Cowie T, et al. Amyloid imaging in Alzheimer’s disease and other dementias. Brain Imaging Behav. 2009;3:246–261. - PubMed
    1. Fodero-Tavoletti MT, Rowe CC, McLean CA, Leone L, Li QX, Masters CL, Cappai R, Villemagne VL. Characterization of PiB binding to white matter in AD and other dementias. J Nucl Med. 2009;50:198–204. - PubMed
    1. Fodero-Tavoletti MT, Mulligan RS, Okamura N, Furumoto S, Rowe CC, Kudo Y, et al. In vitro characterisation of BF227 binding to α-synuclein/Lewy Bodies. Eur J Pharmacol. 2009;617:54–58. - PubMed
1.1.2 2010
    1. Bourgeat P, Chételat G, Villemagne VL, Fripp J, Raniga P, Pike K, et al. β-amyloid burden in the temporal neocortex is related to hippocampal atrophy in elderly subjects without dementia. Neurology. 2010;74:121–127. - PubMed
    1. Ellis KA, Rowe CC, Villemagne VL, Martins RN, Masters CL, Salvado O, Szoeke C, Ames D the AIBL Research Group. Addressing population aging and Alzheimer’s disease through the Australian imaging biomarkers and lifestyle study: collaboration with the Alzheimer’s Disease Neuroimaging Initiative. Alzheimers Dement. 2010;6:291–296. - PubMed
    1. Villemagne VL, Perez KA, Pike KE, Kok WM, Rowe CC, White AR, et al. Blood borne amyloid-β dimer correlates with clinical markers of Alzheimer’s disease. J Neurosci. 2010;30:6315–6322. - PMC - PubMed
    1. Chételat G, Villemagne VL, Bourgeat P, Pike KE, Jones G, Ames D, et al. Relationship between atrophy and β-amyloid deposition in Alzheimer disease. Ann Neurol. 2010;67:317–324. [See also editorial: Rabinovici GD, Roberson ED. Beyond diagnosis: what biomarkers are teaching us about the “bio”logy of Alzheimer disease. Ann Neurol 2010;67:283–5.] - PubMed
    1. Villemagne VL, Pike K, Pejoska S, Boyd A, Power M, Jones G, Masters CL, Rowe CC. 11C-PiB PET ABri imaging in Worster-Drought syndrome (Familial British Dementia): a case report. J Alzheimers Dis. 2010;19:423–428. - PubMed
1.1.3 2011
1.1.3.1 Published
    1. Villemagne VL, Pike KE, Chételat G, Ellis KA, Mulligan R, Bourgeat P, et al. Longitudinal assessment of Aβ burden and cognition in aging and Alzheimer’s disease. Ann Neurol. 2011;69:181–192. - PMC - PubMed
    1. Ellis KA, Rowe CC, Szoeke C, Villemagne VL, Ames D, Chételat G, et al. Advances in structural and molecular neuroimaging in Alzheimer’s disease. Med J Aust. 2011;194:S20–S23. - PubMed
    1. Bahar-Fuchs A, Moss S, Pike KE, Villemagne VL, Masters CL, Rowe C, Savage G. Olfactory deficits and Aβ burden in AD, MCI and healthy ageing: a PiB PET Study. J Alzheimers Dis. 2010;22:1081–1087. - PubMed
    1. Gupta VB, Laws SM, Villemagne VL, Ames D, Bush AI, Ellis KA, et al. Plasma Apolipoprotein E and Alzheimer’s disease risk: the AIBL study of ageing. Neurology. 2011;76:1091–1098. - PubMed
    1. Sittironnait G, Ames D, Bush AI, Faux N, Flicker L, Foster J, et al. Effects of anticholinergic drugs on cognitive function in older Australians: results from the AIBL Study. Dement Geriatr Cogn Disord (Special ASIA issue) 2011;31:173–178. - PubMed