

doi: 10.1038/ncomms8276.
Direct wavefront sensing for high-resolution in vivo imaging in scattering tissue
Affiliations
- PMID: 26073070
- PMCID: PMC4490402
- DOI: 10.1038/ncomms8276
Item in Clipboard
Direct wavefront sensing for high-resolution in vivo imaging in scattering tissue
Nat Commun.
.
Abstract
Adaptive optics by direct imaging of the wavefront distortions of a laser-induced guide star has long been used in astronomy, and more recently in microscopy to compensate for aberrations in transparent specimens. Here we extend this approach to tissues that strongly scatter visible light by exploiting the reduced scattering of near-infrared guide stars. The method enables in vivo two-photon morphological and functional imaging down to 700 μm inside the mouse brain.
Figures
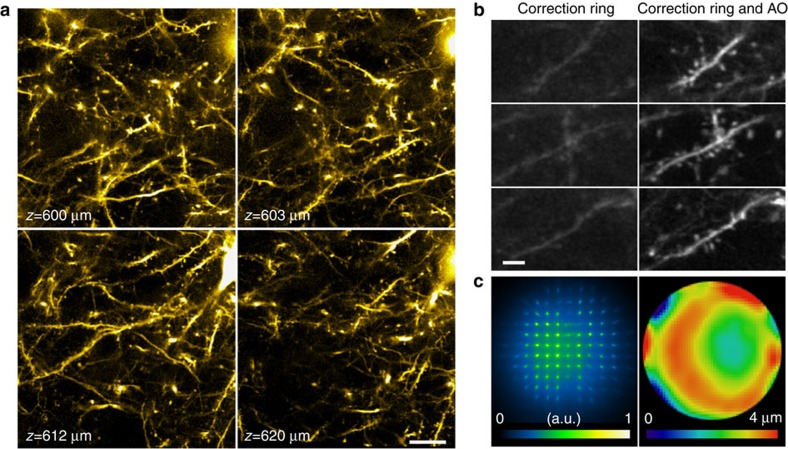
(a) 120 × 120 μm field-of-view single-plane TPE fluorescence images of neurons in a Thy1-YFPH mouse at 600–620 μm below pia after AO correction. Scale bar, 20 μm. (b) TPE fluorescence images of dendrites at 606, 606.5 and 608.5-μm depth taken with objective correction ring adjustment only (left) and correction ring adjustment plus AO (right). Scale bar, 5 μm. (c) SH sensor image (left) for an NIR GS produced by TPE excitation of directly injected ICG, and the corresponding corrective wavefront (right). Representative images from >500 image sections in five mice.
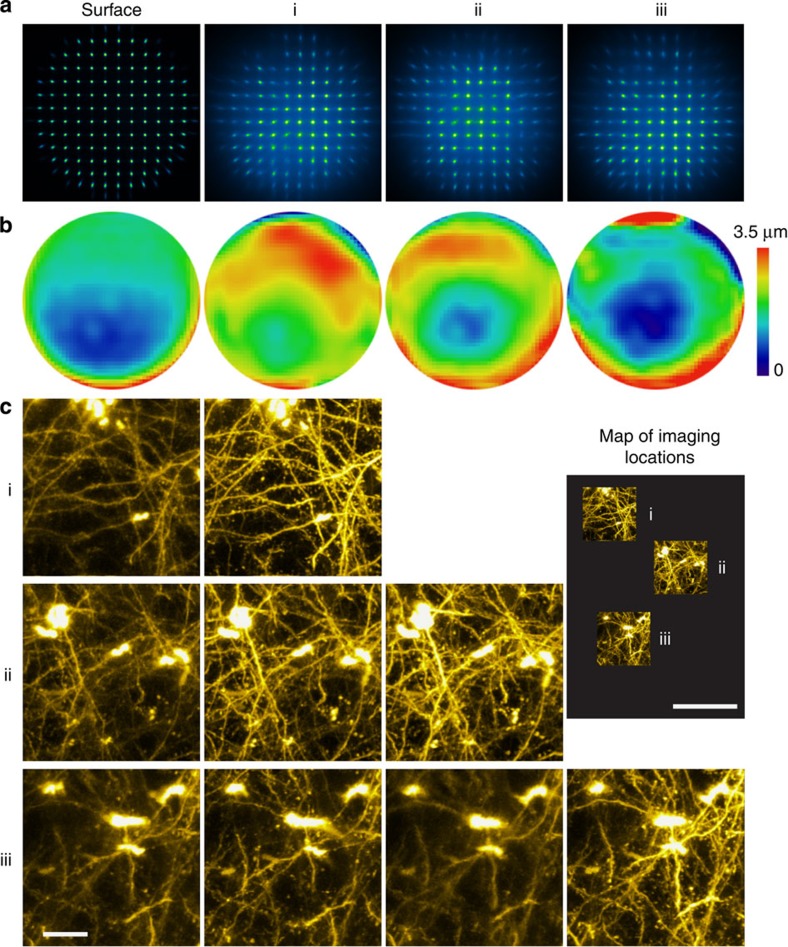
(a) SH images and (b) their corresponding corrective wavefronts obtained at pia surface and three different regions (i, ii and iii) 400 μm below pia of a Thy1-YFPH mouse. (c) Images of regions i, ii and iii obtained with the corrective wavefronts in b, respectively. Scale bar, 20 μm. The inset (‘map of imaging locations') shows the relative positions of regions i, ii and iii. Scale bar, 100 μm (inset).
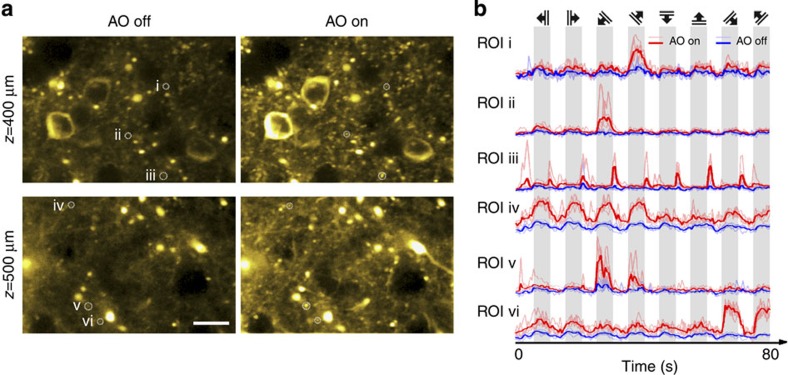
(a) Calcium responses evoked by drifting-grating stimulation 400 and 500 μm below pia in the primary visual cortex of a mouse (Thy1-GCaMP6s line GP4.3) before (left panel) and after (right panel) correction. Brightness of each pixel reflects its s.d. across 800 frames imaged during five repetitions of the drifting-grating stimulus set, and is correlated with the local calcium transient magnitude. Scale bar, 20 μm. (b) Calcium transients at regions of interest (ROI) i–vi, before and after AO correction. Solid colours label averaged transients; faded colours label transients during specific repetitions. Top panel indicates the orientations and drifting directions of the grating stimuli. Representative images from >20 imaging sections in three mice.
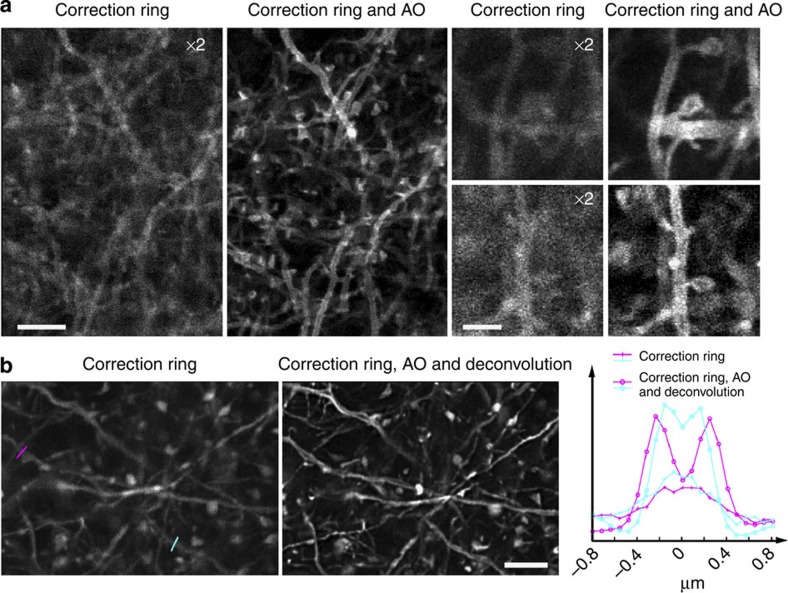
(a) Single-plane confocal images of membrane-labelled neuronal processes ∼10 μm below pia of a mouse (Thy1-ChR2-EYFP) measured with objective correction ring only (left) and correction ring adjustment plus AO (right). The images without AO have been digitally enhanced 2 × in brightness to improve visibility. Scale bars, 5 μm (first column); 2 μm (third column). (b) Confocal images of neuronal processes 3–17 μm below pia having cytosolic expression of YFP in a Thy1-YFPH mouse measured with correction ring adjustment, but either no AO (left) or AO plus deconvolution (right). Line cuts at far right compare the signal strength and resolution in the two cases when imaging two voids (coloured lines at left) likely caused by displacement of cytosolic YFP by the mitochondria within the dendrites. Representative images from >100 imaging sections in two mice. Scale bar, 5 μm.
References
-
- Helmchen F. & Denk W. Deep tissue two-photon microscopy. Nat. Methods 2, 932–940 (2005). - PubMed
-
- Kubby J. A. Adaptive Optics for Biological Imaging Taylor & Francis (2013).
-
- Kobat D. et al. Deep tissue multiphoton microscopy using longer wavelength excitation. Opt. Express 17, 13354–13364 (2009). - PubMed
-
- Ji N., Milkie D. E. & Betzig E. Adaptive optics via pupil segmentation for high-resolution imaging in biological tissues. Nat. Methods 7, 141–147 (2010). - PubMed
Publication types
MeSH terms
Grants and funding
LinkOut - more resources
Full Text Sources
Other Literature Sources
Research Materials
