. 2016 Mar 24;35(12):1565-74.
doi: 10.1038/onc.2015.221. Epub 2015 Jun 15.

High-resolution profiling of histone h3 lysine 36 trimethylation in metastatic renal cell carcinoma

Affiliations

High-resolution profiling of histone h3 lysine 36 trimethylation in metastatic renal cell carcinoma

T H Ho et al. Oncogene. .

Abstract

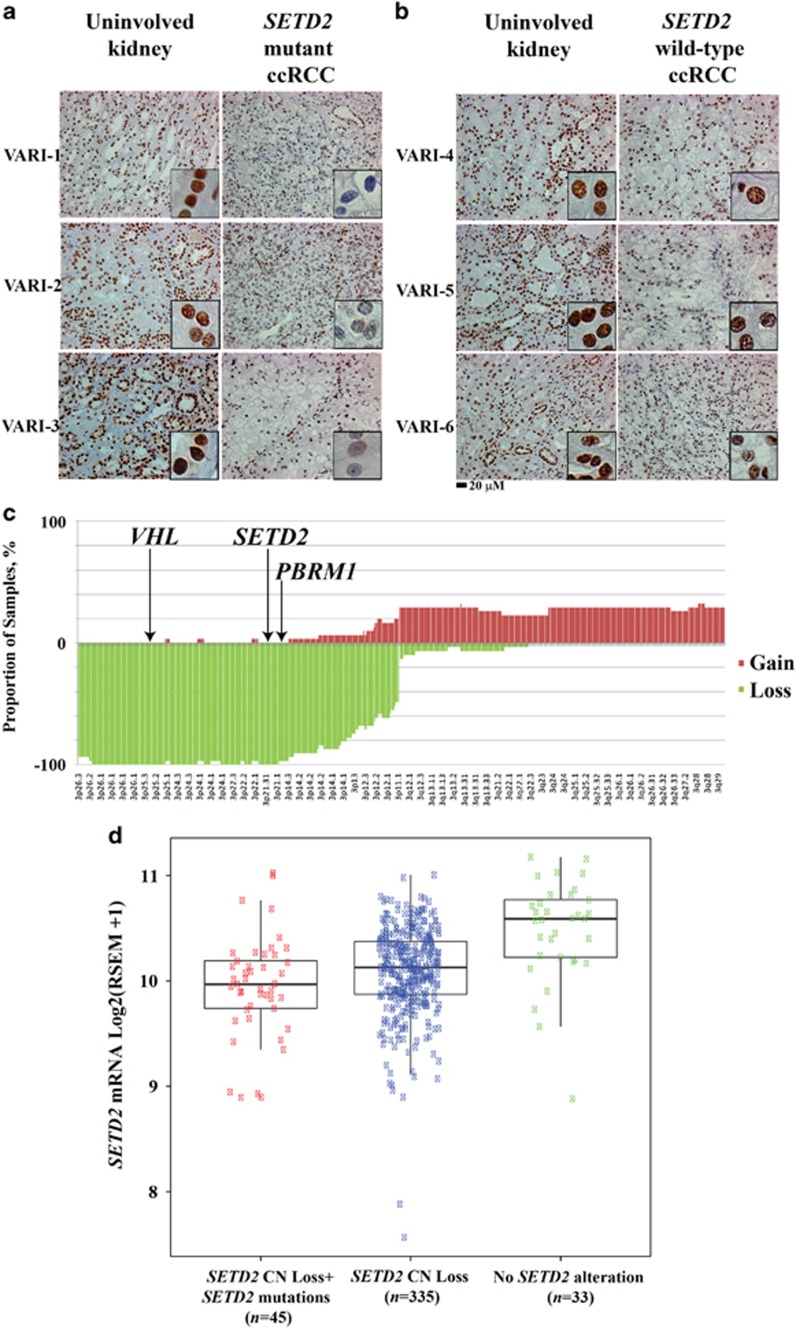
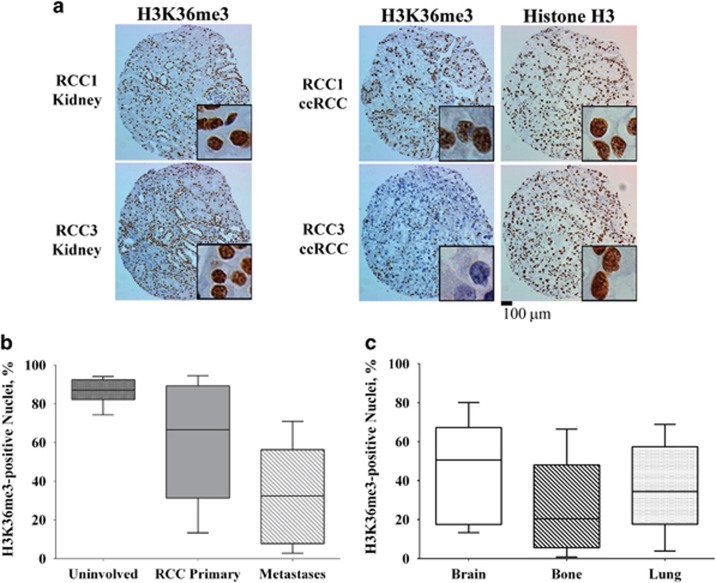
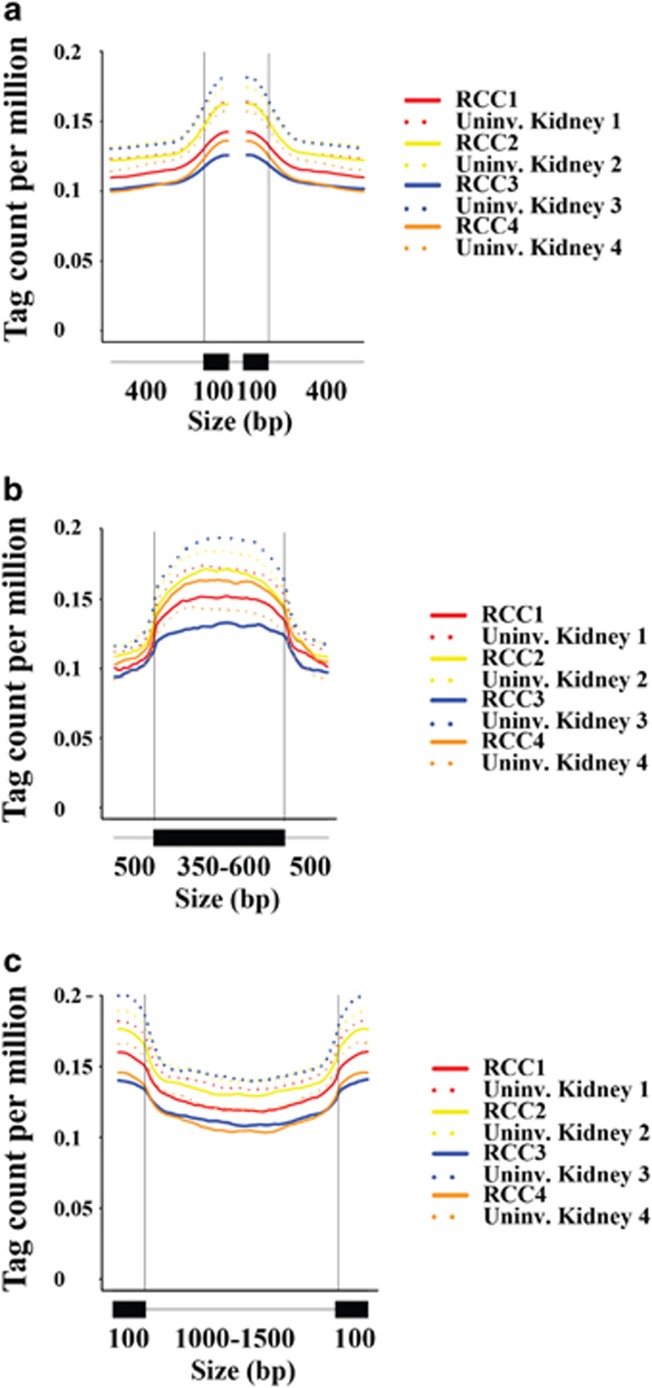
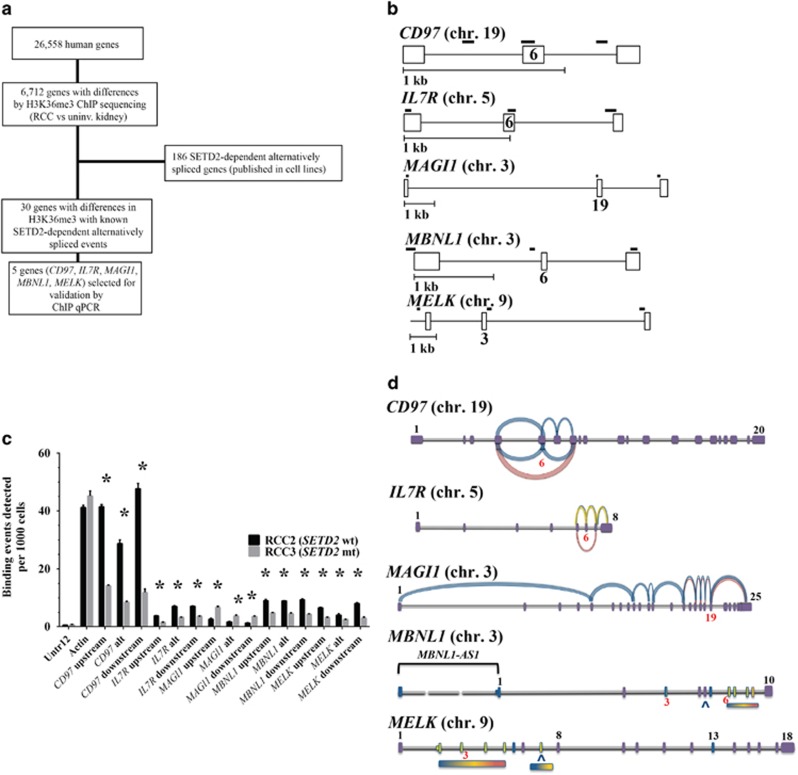
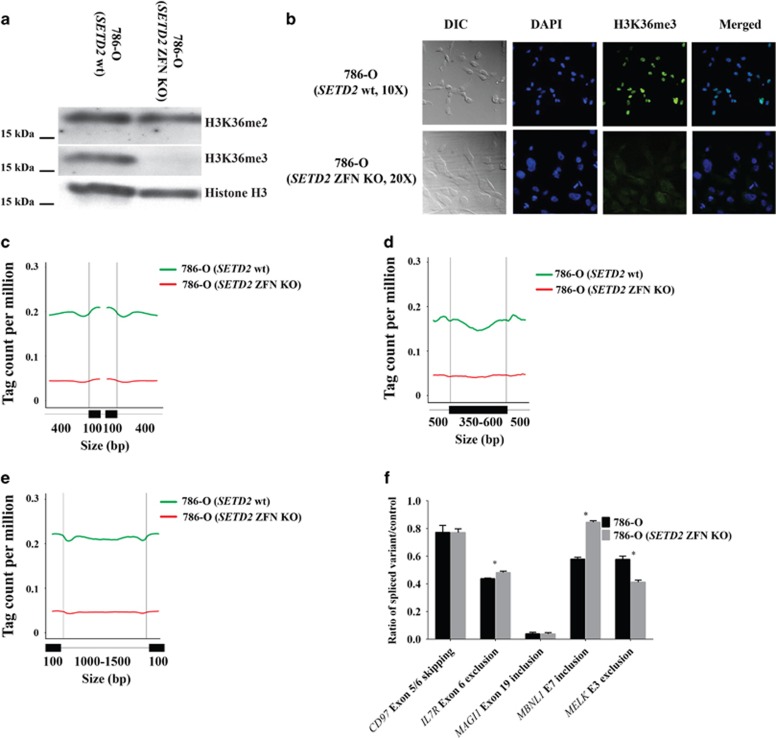
Mutations in SETD2, a histone H3 lysine trimethyltransferase, have been identified in clear cell renal cell carcinoma (ccRCC); however it is unclear if loss of SETD2 function alters the genomic distribution of histone 3 lysine 36 trimethylation (H3K36me3) in ccRCC. Furthermore, published epigenomic profiles are not specific to H3K36me3 or metastatic tumors. To determine if progressive SETD2 and H3K36me3 dysregulation occurs in metastatic tumors, H3K36me3, SETD2 copy number (CN) or SETD2 mRNA abundance was assessed in two independent cohorts: metastatic ccRCC (n=71) and the Cancer Genome Atlas Kidney Renal Clear Cell Carcinoma data set (n=413). Although SETD2 CN loss occurs with high frequency (>90%), H3K36me3 is not significantly impacted by monoallelic loss of SETD2. H3K36me3-positive nuclei were reduced an average of ~20% in primary ccRCC (90% positive nuclei in uninvolved vs 70% positive nuclei in ccRCC) and reduced by ~60% in metastases (90% positive in uninvolved kidney vs 30% positive in metastases) (P<0.001). To define a kidney-specific H3K36me3 profile, we generated genome-wide H3K36me3 profiles from four cytoreductive nephrectomies and SETD2 isogenic renal cell carcinoma (RCC) cell lines using chromatin immunoprecipitation coupled with high-throughput DNA sequencing and RNA sequencing. SETD2 loss of methyltransferase activity leads to regional alterations of H3K36me3 associated with aberrant RNA splicing in a SETD2 mutant RCC and SETD2 knockout cell line. These data suggest that during progression of ccRCC, a decline in H3K36me3 is observed in distant metastases, and regional H3K36me3 alterations influence alternative splicing in ccRCC.


Figures

Figure 1
Figure 1
Analysis of SETD2 and H3K36me3 in clear cell renal cell carcinoma (ccRCC) specimens. H3K36me3 immunohistochemical staining of uninvolved kidney and tumor specimens with mutant SETD2 (a) and with wild-type SETD2 (b). SETD2 mutations correlate with decreased H3K36me3 in early-stage ccRCC. Scale bar, 20 μm. (c) Virtual karyotypes formalin-fixed paraffin-embedded metastatic ccRCC specimens (n=51) were generated using Affymetrix single-nucleotide polymorphism arrays. Copy number (CN) loss of the SETD2 gene locus was observed in >90% of tested ccRCC tumors. SETD2 is located at 3p21.31; VHL, 3p25.3; BAP1, 3p21.31-p21.2 (not shown); PBRM1, 3p21.1. (d) Scatter plot and box plot overlay of SETD2 mRNA abundance estimates by RNA-Seq by Expectation-Maximization (RSEM) in the Cancer Genome Atlas Kidney Renal Clear Cell Carcinoma data set (n=413). Boxes represent the 25th, median and 75th interquartile ranges.
Figure 2
Figure 2
H3K36me3 immunohistochemical analysis of uninvolved kidney, clear cell renal cell carcinoma (ccRCC) and metastases. (a) Compared with matched uninvolved kidney parenchyma, a subset of ccRCC tumors had decreased H3K36me3. Top panel, >60% positive nuclei; bottom panel, <10% positive nuclei. Scale bar, 100 μm. (b) Box-and-whiskers plots of H3K36me3 in tissue microarrays, representing uninvolved kidney tissue (n=30), primary RCC tumors (n=71) and metastases (n=45). Boxes represent the 25th, median and 75th percentiles. Whiskers represent the 10th and 90th percentiles. (c) H3K36me3 in brain (n=12), bone (n=27) and lung (n=6) metastases.
Figure 3
Figure 3
Whole-genome H3K36me3 chromatin immunoprecipitation of four paired nephrectomy samples (uninvolved kidney and renal cell carcinoma (RCC). (a–c) H3K36me3 signal intensity across intron–exon and exon–intron boundaries. Only genes with at least three exons were selected. (a) For each gene, the first and last exons, as well as exons of <100 bp and introns of <400 bp were excluded from the plots. Each colored line represents the H3K36me3-binding profile over 400 bp intron and 100 bp exon sequence, with the two vertical lines denoting intron–exon and exon–intron junction sites, respectively. (b) H3K36me3 signal intensity across exons of 350–600 bp and 500-bp flanking intronic sequence. Only exons of 350–600 bp flanked by introns of ⩾500 bp at both sides were selected. (c) H3K36me3 signal intensity across introns of 1000–1500 bp and 100-bp flanking exonic sequence. Only introns of 1000–1500 bp flanked by exons of ⩾100 bp at both sides were selected.
Figure 4
Figure 4
Analysis of SETD2-genotyped clear cell renal cell carcinoma (ccRCC). (a) Selection of 30 candidate genes for further analysis of H3K36me3. The average fragment densities across gene bodies were determined for 26 558 human genes. Analysis of variance comparing the average fragment densities of genes from ccRCC to those of uninvolved kidney identified 6712 genes with differences in H3K36me3 (P<0.05). One hundred eighty-six genes were previously reported to undergo SETD2-dependent alternative splicing in human mesenchymal stem cells. (b) Intragenic regions selected for ChIP qPCR analysis. The alternative exons are numbered and the solid bold lines represent the regions examined by three PCR primer pairs (upstream, alternative exon and downstream). (c) ChIP qPCR assay of DNA isolated from SETD2-wild-type (wt) and SETD2 mutant (mt) ccRCCs. Error bars represent s.e.m. Asterisk (*) indicates P<0.05 by t-test. (d) Relative abundance of splicing isoforms identified by RNA sequencing of SETD2 mt ccRCC. RNA sequencing predictions identify specific exons, or 'hotspot' regions containing several exons, which are involved in alternative splicing events. RNA abundances are based on fragments per kilobase of exon per million fragments mapped values binned into high (red), medium (gold) and low (blue) transcripts; exons are numerically labeled. Exons examined by ChIP qPCR are labeled in red.
Figure 5
Figure 5
Analysis of Isogenic SETD2 renal cell carcinoma cell lines. The VHL-deficient, SETD2 wild-type 786-O cell line was transfected with zinc finger constructs that generate a deletion in the SETD2 catalytic domain. Single cell-derived clones in a 96-well plate were analyzed by fragment length analysis to identify those with frameshifts (11 bp deletion) and then expanded for additional analyses. (a) Western blot confirming depletion of H3K36me3, but not H3K36me2. Total levels of histone H3 was used as a loading control. (b) Immunofluorescence confirming depletion of H3K36me3 from an expanded single-cell clone. (c) For each gene, the first and last exons, as well as exons of <100 bp and introns of <400 bp were excluded from the plots. Each colored line represents the H3K36me3-binding profile over 400 bp intron and 100 bp exon sequence, with the two vertical lines denoting intron–exon and exon–intron junction sites, respectively. (d) H3K36me3 signal intensity across exons of 350–600 bp and 500 bp flanking intronic sequence. Only exons of 350–600 bp flanked by introns of ⩾500 bp at both sides were selected. (e) H3K36me3 signal intensity across introns of 1000–1500 bp and 100 bp flanking exonic sequence. Only introns of 1000–1500 bp flanked by exons of ⩾100 bp at both sides were selected. (f) Analysis of alternative splicing. Two sets of reverse transcription–PCR primers were designed to quantitate alternative splicing isoforms. Results are expressed as a normalized ratio of splicing isoforms to control with error bars representing standard error. DAPI, 4',6-diamidino-2-phenylindole; DIC, differential interference contrast; ZFN, zinc finger nuclease.

References

    1. Cohen HT, McGovern FJ. Renal-cell carcinoma. N Engl J Med 2005; 353: 2477–2490. - PubMed
    1. Linehan WM, Srinivasan R, Schmidt LS. The genetic basis of kidney cancer: a metabolic disease. Nat Rev Urol 2010; 7: 277–285. - PMC - PubMed
    1. Varela I, Tarpey P, Raine K, Huang D, Ong CK, Stephens P et al. Exome sequencing identifies frequent mutation of the SWI/SNF complex gene PBRM1 in renal carcinoma. Nature 2011; 469: 539–542. - PMC - PubMed
    1. Comprehensive molecular characterization of clear cell renal cell carcinoma. Nature 2013; 499: 43–49. - PMC - PubMed
    1. Pena-Llopis S, Vega-Rubin-de-Celis S, Liao A, Leng N, Pavia-Jimenez A, Wang S et al. BAP1 loss defines a new class of renal cell carcinoma. Nat Genet 2012; 44: 751–759. - PMC - PubMed

Publication types