. 2015 Jul 7;22(1):175-88.
doi: 10.1016/j.cmet.2015.05.008. Epub 2015 Jun 11.

Discrete BDNF Neurons in the Paraventricular Hypothalamus Control Feeding and Energy Expenditure

Affiliations

Discrete BDNF Neurons in the Paraventricular Hypothalamus Control Feeding and Energy Expenditure

Juan Ji An et al. Cell Metab. .

Abstract

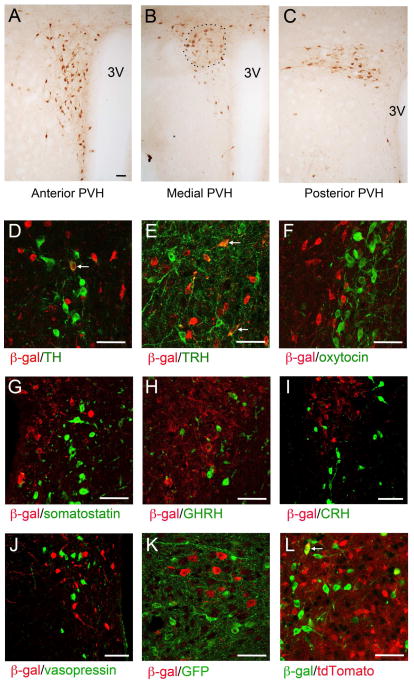
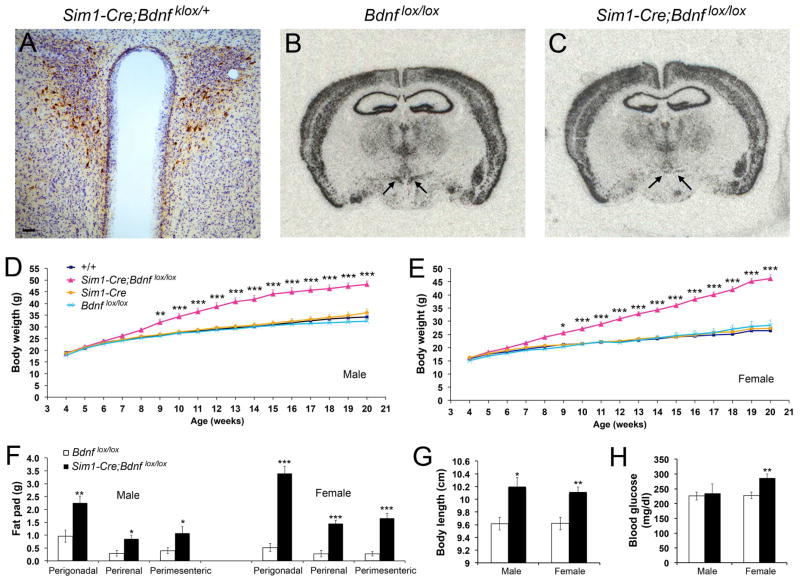
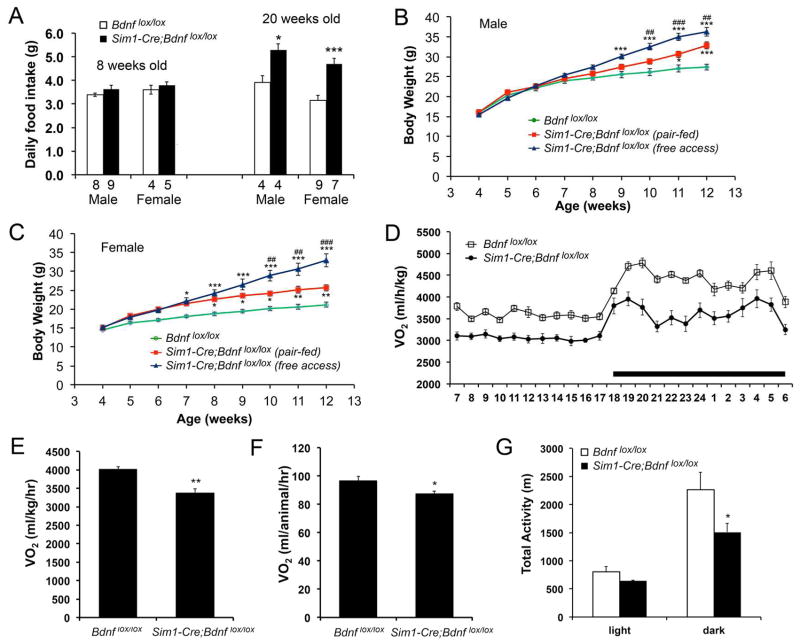
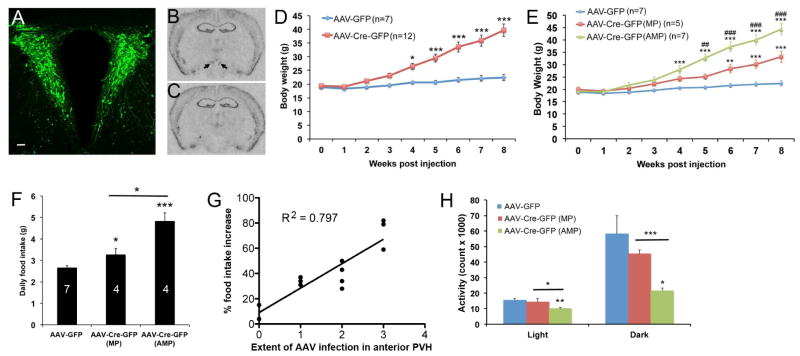
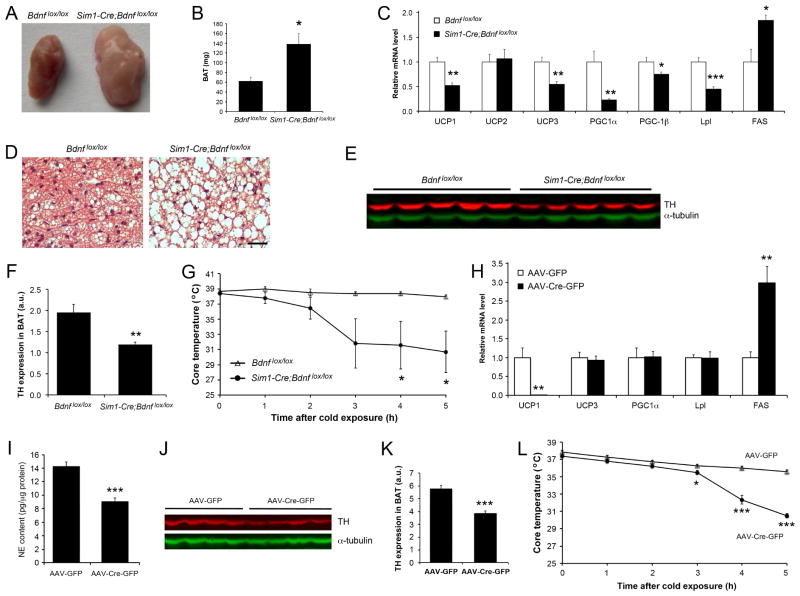
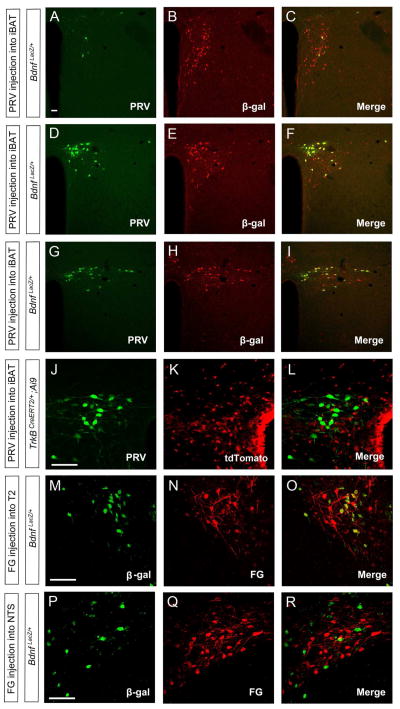
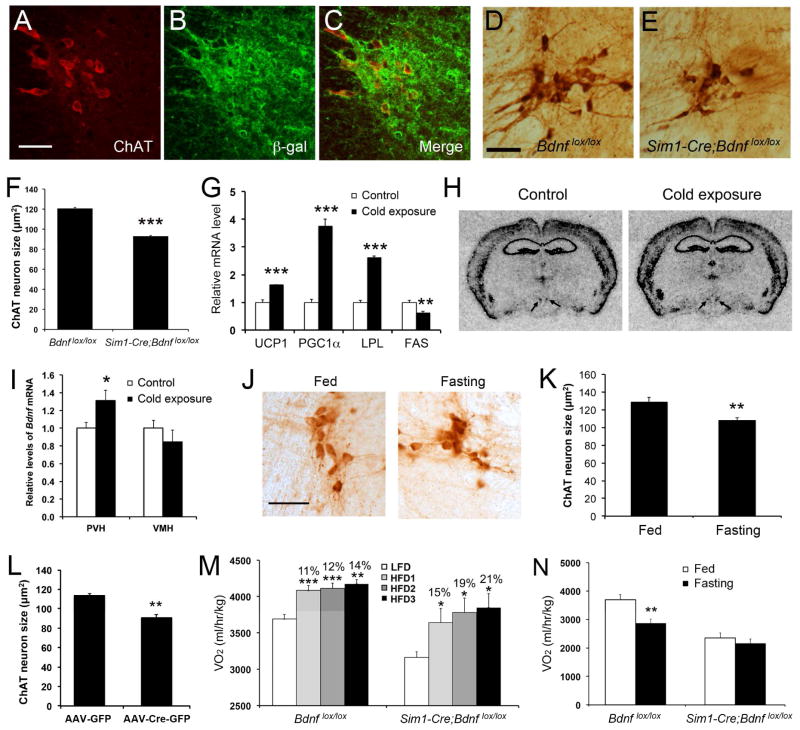
Brain-derived neurotrophic factor (BDNF) is a key regulator of energy balance; however, its underlying mechanism remains unknown. By analyzing BDNF-expressing neurons in paraventricular hypothalamus (PVH), we have uncovered neural circuits that control energy balance. The Bdnf gene in the PVH was mostly expressed in previously undefined neurons, and its deletion caused hyperphagia, reduced locomotor activity, impaired thermogenesis, and severe obesity. Hyperphagia and reduced locomotor activity were associated with Bdnf deletion in anterior PVH, whereas BDNF neurons in medial and posterior PVH drive thermogenesis by projecting to spinal cord and forming polysynaptic connections to brown adipose tissues. Furthermore, BDNF expression in the PVH was increased in response to cold exposure, and its ablation caused atrophy of sympathetic preganglionic neurons. Thus, BDNF neurons in anterior PVH control energy intake and locomotor activity, whereas those in medial and posterior PVH promote thermogenesis by releasing BDNF into spinal cord to boost sympathetic outflow.


Figures

Figure 1
Figure 1. BDNF expression in the PVH as revealed by anti-β-galactosidase immunohistochemistry in BdnfLacZ/+ mice
(A–C) Immunohistochemistry images showing the distribution of BDNF expression in the PVH. The approximate location of the PVHmpd is outlined. 3V, the 3rd ventricle. (D–J) Coexpression of BDNF with tyrosine hydroxylase (TH), thyrotropin-releasing hormone (TRH), oxytocin, somatostatin, growth hormone releasing hormone (GHRH), corticotropin-releasing hormone (CRH), and vasopressin in the PVH. BDNF-expressing neurons were marked by β-galactosidase (β-gal) in BdnfLacZ/+ mice. Arrows denote representative BDNF neurons that also express TH or TRH. (K) Coexpression of BDNF with MC4R in the PVH. BDNF- and MC4R-expressing neurons were marked with β-galactosidase and GFP, respectively, in BdnfLacZ/+;Mc4r-tau-GFP mice. (L) Coexpression of BDNF with TrkB in the PVH. BDNF- and TrkB-expressing neurons were marked with β-galactosidase and tdTomato, respectively, in BdnfLacZ/+;TrkBCreERT2/+;Ai9/+ mice. The arrow denotes a representative BDNF neuron that also expresses TrkB. The scale bar represents 50 μm. See also Figure S1.
Figure 2
Figure 2. Deletion of the Bdnf gene in the PVH using the Sim1-Cre transgene
(A) Immunohistochemistry image showing β-galactosidase-expressing neurons in the PVH of Sim1-Cre;Bdnfklox/+ mice. The brain section was counterstained with Nissl. The scale bar represents 50 μm. (B and C) In situ hybridization of Bdnf mRNA revealing abolishment of Bdnf gene expression in the PVH of Sim1-Cre;Bdnflox/lox mice at 4 months of age. Arrows denote the PVH. (D) Body weight of male Sim1-Cre;Bdnflox/lox mice and littermate controls. Two-way ANOVA indicates a significant effect of genotypes on body weight: F(3, 663) = 379.84 (n=9–14 mice per genotype), P < 0.001. (E) Body weight of female Sim1-Cre;Bdnflox/lox mice and littermate controls. Two-way ANOVA indicates a significant effect of genotypes on body weight: F(3, 612) = 462.53 (n=8–13 mice per genotype), P < 0.001. (F – H) Fat pad mass, body length, and blood glucose levels in Bdnflox/lox mice and Sim1-Cre;Bdnflox/lox mice at 20 weeks of age (n=5–8 mice per group). Error bars indicate standard errors. See also Figure S2.
Figure 3
Figure 3. Reduced energy expenditure in Sim1-Cre;Bdnflox/lox mice
(A) Daily food intake at 8 and 20 weeks of age. The numbers of mice used are indicated under each column. (B) Body weight of male Sim1-Cre;Bdnflox/lox mice with free access to food or fed with the amount of food ingested by male Bdnflox/lox mice. Two-way ANOVA for the effect of treatment on body weight: F(2, 198) = 57.22 (n=7–10 mice per group), P < 0.001. * P < 0.05 and *** P < 0.001 when compared to Bdnflox/lox mice using Bonferroni post-hoc test. ## P < 0.01 and ### P < 0.001 when mutant mice with free access to food were compared to pair-fed mutant mice using Bonferroni post-hoc test. (C) Body weight of female Sim1-Cre;Bdnflox/lox mice with free access to food or fed with the amount of food ingested by female Bdnflox/lox mice. Two-way ANOVA for the effect of treatment on body weight: F(2, 198) = 102.12 (n=6–11 mice per group), P < 0.001. * P < 0.05, ** P < 0.01, and *** P < 0.001 when compared to Bdnflox/lox mice using Bonferroni post-hoc test. ## P < 0.01 and ### P < 0.001 when mutant mice with free access to food were compared to pair-fed mutant mice using Bonferroni post-hoc test. (D) Distribution of VO2 over a 24-hr period in male mice at 8 weeks of age. The body weights of the mice were 24.0 ± 0.5 g for Bdnflox/lox and 26.1 ± 1.3 g for Sim1-Cre;Bdnflox/lox (P = 0.143). Two-way ANOVA for the effect of genotype: F(1, 216) = 359.74 (n=5–6 per genotype), P < 0.001. (E–G) Oxygen consumption and locomotor activity of male Bdnflox/lox and Sim1-Cre;Bdnflox/lox mice at 8 weeks of age (n=5–6 mice per genotype). Error bars indicate standard errors.
Figure 4
Figure 4. Deletion of the Bdnf gene in the adult PVH using Cre-expressing AAV
(A) Injection of AAV-GFP into the PVH. The scale bar represents 50 μm. (B and C) In situ hybridization of Bdnf mRNA in brain sections of Bdnflox/lox mice injected with either AAV-GFP (B) or AAV-Cre-GFP (C). Arrows denote Bdnf mRNA signals in the PVH. (D) Body weight of female Bdnflox/lox mice injected with either AAV-GFP or AAV-Cre-GFP. Two-way ANOVA indicates a significant difference in body weight between the 2 groups: F(1, 153) = 124.56, P < 0.001. (E) Body weight of female Bdnflox/lox mice injected with either AAV-GFP or AAV-Cre-GFP. Two-way ANOVA indicates a significant difference in body weight among the 3 groups: F(2, 144) = 116.81, P < 0.001. ** P < 0.01 and *** P < 0.001 when compared to the AAV-GFP group using Bonferroni post-hoc test. ## P < 0.01 and ### P < 0.001 when the AAV-Cre-GFP (AMP) group was compared to the AAV-Cre-GFP (MP) group using Bonferroni post-hoc test. (F) Daily food intake during the 4th week of the post-injection period. The numbers inside columns indicate animal numbers. (G) Correlation between the extent of AAV infection in the anterior PVH and hyperphagia. The data used in the plot is from the animals listed in Figure S3G, except animal AAV-Cre-GFP2 in which AAV infection in the PVH was minimal. P < 0.001. (H) Locomotor activity of Bdnflox/lox mice 9 weeks after AAV injection. Animal number was 8, 5, and 6 for AAV-GFP, AAV-Cre-GFP (MP), and AAV-Cre-GFP (AMP), respectively. Error bars indicate standard errors. See also Figure S3.
Figure 5
Figure 5. Impaired adaptive thermogenesis in mice where Bdnf is deleted in the PVH
(A and B) Appearance and mass of iBAT in Bdnflox/lox and Sim1-Cre;Bdnflox/lox mice at 8 weeks of age. (C) Levels of mRNAs in iBAT of Bdnflox/lox and Sim1-Cre;Bdnflox/lox mice at 8 weeks of age (n=5 mice per genotype). (D) H&E staining of iBAT sections from Bdnflox/lox and Sim1-Cre;Bdnflox/lox mice at 8 weeks of age. Scale bar, 50 μm. (E) Immunoblotting of iBAT extracts from mice at 8 weeks of age using antibodies against tyrosine hydroxylase (TH) and α-tubulin. (F) Quantification of the immunoblot described in (E). (G) Rectal temperature of mice at 10 weeks of age after exposure to 10°C (n=5 mice per genotype). (H) Levels of mRNAs in iBAT of Bdnflox/lox mice injected with either AAV-Cre (n=5) or AAV-Cre-GFP (n=7). (I) Levels of norepinephrine (NE) in iBAT of Bdnflox/lox mice injected with either AAV-Cre (n=9) or AAV-Cre-GFP (n=15). (J) Immunoblotting of iBAT extracts from Bdnflox/lox mice injected with either AAV-Cre or AAV-Cre-GFP using antibodies against TH and α-tubulin. (K) Quantification of the immunoblot described in (J). (L) Rectal temperature of Bdnflox/lox mice injected with either AAV-Cre (n=5) or AAV-Cre-GFP (n=5) after exposure to 10°C. Error bars indicate standard errors. See also Figures S4.
Figure 6
Figure 6. Direct projection of BDNF neurons in the PVH to the spinal cord
(A–I) Confocal images revealing that some BDNF neurons marked by β-galactosidase (β-gal) were labeled by PRV injected into iBAT in the anterior PVH (A–C), medial PVH (D–F), and posterior PVH (G–I). (J–L) Representative confocal images showing that PVH neurons labeled by PRV injected into iBAT are distinct from TrkB neurons marked by tdTomato. (M–O) Confocal images showing that fluorogold (FG) injected into T2 segment of the spinal cord labels many BDNF neurons in the PVH. (P–R) Confocal images showing that fluorogold injected into the NTS labels only a small number of BDNF neurons in the PVH. The scale bars represent 50 μm. See also Figures S5 and S6.
Figure 7
Figure 7. The role of PVH BDNF in adaptive thermogenesis
(A–C) Confocal images revealing coexpression of ChAT and β-galactosidase in the thoracic IML of TrkBLacZ/+ mice. (D–F) Atrophy of ChAT neurons in the thoracic IML of Sim1-Cre;Bdnflox/lox mice (n=5 mice per genotype). (G) Levels of mRNA for thermogenic genes in iBAT, analyzed with real-time PCR. C57BL/6J mice were housed at room temperature or 10°C for 3 days (n=4 mice per group). (H) Representative images of in situ hybridization for Bdnf mRNA. C57BL/6J mice were housed at room temperature or 10°C for 3 days. Arrows denote the PVH. (I) Quantification of Bdnf mRNA levels in the PVH and VMH of cold-exposed mice. (J and K) Atrophy of ChAT neurons in the thoracic IML of food-deprived mice. C57BL/6J mice were deprived of food for 2 days (n=5 mice per group). (L) Cell body size of ChAT neurons in the thoracic IML of Bdnflox/lox mice injected with either AAV-GFP or AAV-Cre-GFP into the PVH (n=4 mice per group). (M) Energy expenditure of Bdnflox/lox and Sim1-Cre;Bdnflox/lox mice during low-fat diet feeding (LFD) and subsequent 3-day HFD feeding (HFD1, HFD2 and HFD3). The numbers indicate % increase in VO2 over the LFD control. Mouse number was 4 or 5 per genotype. (N) Energy expenditure of Sim1-Cre;Bdnflox/lox mice during food deprivation (n=4–6 mice per genotype). The scale bar represents 50 μm. Error bars indicate standard errors. See also Figure S7

References

    1. An JJ, Gharami K, Liao GY, Woo NH, Lau AG, Vanevski F, Torre ER, Jones KR, Feng Y, Lu B, et al. Distinct role of long 3′ UTR BDNF mRNA in spine morphology and synaptic plasticity in hippocampal neurons. Cell. 2008;134:175–187. - PMC - PubMed
    1. Atasoy D, Betley JN, Su HH, Sternson SM. Deconstruction of a neural circuit for hunger. Nature. 2012;488:172–177. - PMC - PubMed
    1. Bachman ES, Dhillon H, Zhang CY, Cinti S, Bianco AC, Kobilka BK, Lowell BB. betaAR signaling required for diet-induced thermogenesis and obesity resistance. Science. 2002;297:843–845. - PubMed
    1. Balthasar N, Dalgaard LT, Lee CE, Yu J, Funahashi H, Williams T, Ferreira M, Tang V, McGovern RA, Kenny CD, et al. Divergence of melanocortin pathways in the control of food intake and energy expenditure. Cell. 2005;123:493–505. - PubMed
    1. Baydyuk M, Xie Y, Tessarollo L, Xu B. Midbrain-derived neurotrophins support survival of immature striatal projection neurons. J Neurosci. 2013;33:3363–3369. - PMC - PubMed

Publication types

Substances

LinkOut - more resources