. 2015 Jul 2;97(1):177-85.
doi: 10.1016/j.ajhg.2015.05.011. Epub 2015 Jun 11.

Loss-of-Function Mutations in APPL1 in Familial Diabetes Mellitus

Affiliations

Loss-of-Function Mutations in APPL1 in Familial Diabetes Mellitus

Sabrina Prudente et al. Am J Hum Genet. .

Abstract

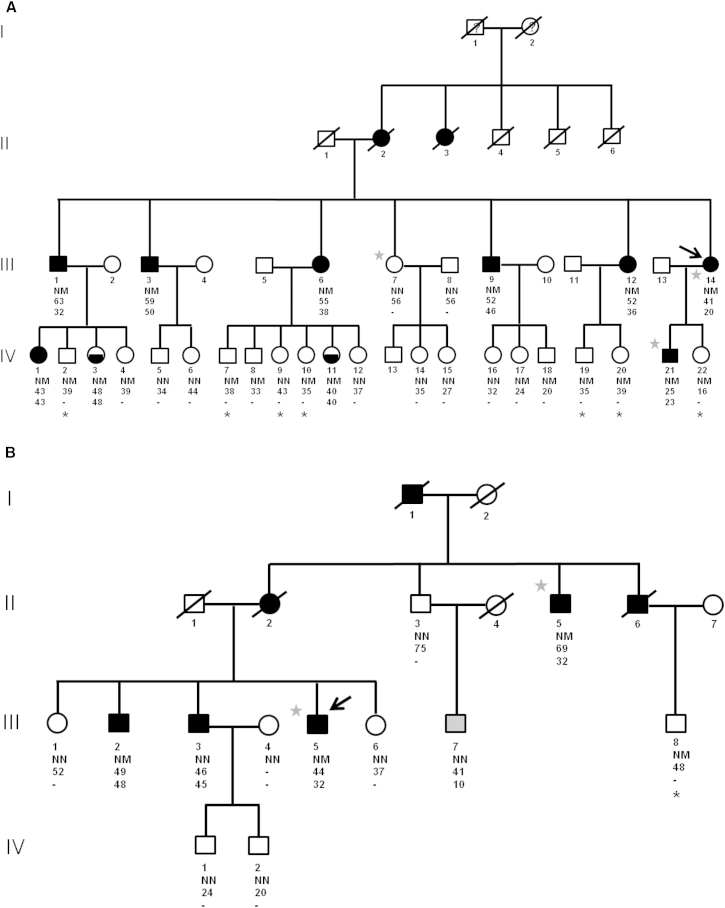
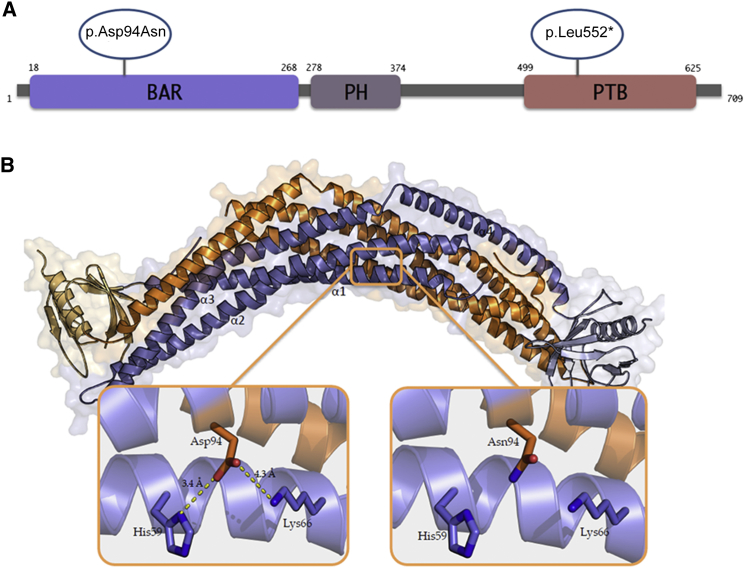
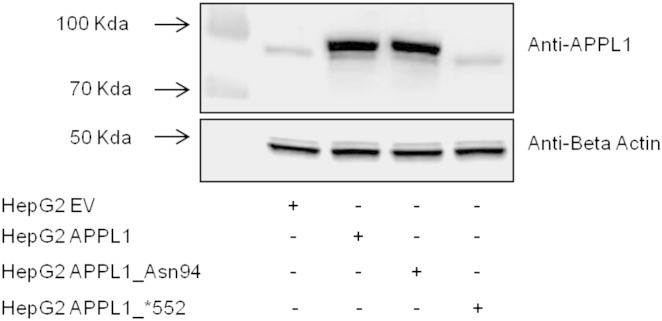
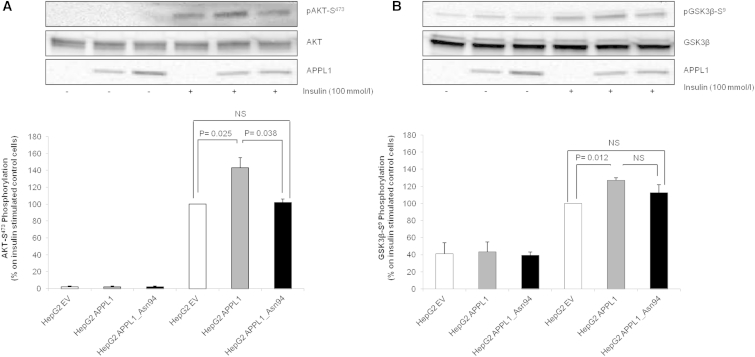
Diabetes mellitus is a highly heterogeneous disorder encompassing several distinct forms with different clinical manifestations including a wide spectrum of age at onset. Despite many advances, the causal genetic defect remains unknown for many subtypes of the disease, including some of those forms with an apparent Mendelian mode of inheritance. Here we report two loss-of-function mutations (c.1655T>A [p.Leu552(∗)] and c.280G>A [p.Asp94Asn]) in the gene for the Adaptor Protein, Phosphotyrosine Interaction, PH domain, and leucine zipper containing 1 (APPL1) that were identified by means of whole-exome sequencing in two large families with a high prevalence of diabetes not due to mutations in known genes involved in maturity onset diabetes of the young (MODY). APPL1 binds to AKT2, a key molecule in the insulin signaling pathway, thereby enhancing insulin-induced AKT2 activation and downstream signaling leading to insulin action and secretion. Both mutations cause APPL1 loss of function. The p.Leu552(∗) alteration totally abolishes APPL1 protein expression in HepG2 transfected cells and the p.Asp94Asn alteration causes significant reduction in the enhancement of the insulin-stimulated AKT2 and GSK3β phosphorylation that is observed after wild-type APPL1 transfection. These findings-linking APPL1 mutations to familial forms of diabetes-reaffirm the critical role of APPL1 in glucose homeostasis.


Figures

Figure 1
Figure 1
Pedigree Structures of the Two Families with APPL1 Mutations Shown are families from Italy (A) and from the US (B). Round and square symbols denote females and males, respectively. Filled and open symbols denote diabetic and non-diabetic subjects, respectively; half-filled symbols denote individuals with pre-diabetes (see definition in the text). The arrow points to the proband. Gray stars indicate family members in which WES was performed. Black stars indicate those individuals who did not undergo OGTT. Gray symbol denotes individual with type 1 diabetes. NM denotes presence of heterozygous APPL1 mutations (p.Leu552 in the Italian family, p.Asp94Asn in the US family); NN denotes absence of such mutations. The age at examination is reported for each individual under the corresponding symbol; the age at diagnosis is reported for diabetic or prediabetic individuals under the age at examination.
Figure 2
Figure 2
In Silico Prediction of the Effects of the Identified APPL1 Mutations (A) Schematic representation of the domains of the APPL1 protein and position of the identified alteration. Abbreviations are as follows: BAR, Bin/Amphiphysin/Rvs domain; PH, pleckstrin homology domain; PTB, phosphotyrosine-binding domain. Orange circles indicate the missense and the nonsense mutation at positions 94 and 552, respectively. (B) Structure of the BAR-PH domain dimer of human APPL1 (PDB: 2Q13) and predicted effect of p.Asp94Asn alteration. One monomer is shown in orange, the other one in violet. The concave surface at the bottom is the lipid-binding surface enriched in positively charged residues, which is needed for the interaction with the plasma membrane. Asp94, located on the α2 helix, and the positively charged residues (His59 and Lys66), located on the α1 helix, are represented by sticks. Interactions and atomic distances between residues are visualized by yellow dashed lines. The substitution of the negatively charged amino acid Asp94 with a neutral one (Asn94) disrupts salt bridges with His59 and Lys66 (right). Inspection, measurement, and rendering were made with PyMOL software.
Figure 3
Figure 3
In Vitro Effects of the APPL1 Mutations on Protein Levels HepG2 cells were transiently transfected with APPL1, APPL1_Asn94, APPL1_552, or empty vector (HEPG2_EV). After 48 hr transfection, cells were lysed and APPL1 and BETA ACTIN lower blot expression were evaluated by immunoblot analyses. In brief, equal amounts of protein from cell lysates were separated by SDS-PAGE and probed with anti-APPL1 (Cell Signaling) and anti-BETA ACTIN (Santa Cruz Biotechnology)-specific antibodies. A representative blot is shown.
Figure 4
Figure 4
Effect of APPL1_Asn94 Transfection on Akt-S473 and GSK3β-S Phosphorylation HepG2 cells were transiently transfected with APPL1, APPL1_Asn94, or empty vector. After 48 hr, cells were stimulated with 100 nmol/l insulin for 5 min and then lysed. Phospho-AKT-S473 (A) or phospho-GSK3β-S (B) were evaluated by immunoblot analyses. In brief, equal amount of protein from cell lysates were separated by SDS-PAGE and probed with anti-phospho-AKT-S473 (A, upper blot), anti-AKT (A, middle blot), anti-APPL1 (A and B, lower blot), or anti-phospho-GSK3β-S (B, upper blot) and anti-GSK3β (B, middle blot) specific antibodies, respectively. Gel images were acquired with Molecular Imager ChemiDoc XRS (Biorad) and analyzed with Kodak Molecular Imaging Software 4.0 or IMAGEJ 1.40 g (Wayne Rasband, NIH). A representative blot for each condition is shown. Bars represent the percentage of AKT-S473 phosphorylation/AKT OD ratio (A) or GSK3β-S/GSK3β OD ratio (B) in insulin-stimulated control cells. Data are means ± SD of three experiments in separate times.
Figure 5
Figure 5
Correlation between APPL1 Expression and Glucose-Induced Insulin Secretion in Human Islets Pancreata were collected from ten non-diabetic brain-dead multiorgan donors (age: 65.2 ± 13.6 years; 50% females) and pancreatic islets were prepared as previously described. Glucose-induced insulin secretion was measured and then expressed as stimulation index (SI) calculated by dividing insulin release after glucose stimulation at 16.7 mmol/l over basal insulin release (i.e., at glucose 3.3 mmol/l). Prime Time Standard qPCR Assays (Integrated DNA Technologies) were used to quantify relative gene expression levels of APPL1, GAPDH (MIM: 138400), and BETA ACTIN (MIM: 102630) on ABI-PRISM 7900 (Applera Life Technologies). APPL1 expression was calculated by using the comparative ΔCT method. Relationship between SI and APPL1 expression was evaluated by Pearson’s correlation with SPSS 13 software. APPL1 expression was significantly associated with SI (r2 = 0.50, p = 0.022). This association remained significant also after adjusting for age and gender (p = 0.048).

References

    1. Roglic G., Unwin N., Bennett P.H., Mathers C., Tuomilehto J., Nag S., Connolly V., King H. The burden of mortality attributable to diabetes: realistic estimates for the year 2000. Diabetes Care. 2005;28:2130–2135. - PubMed
    1. Vaxillaire M., Froguel P. Monogenic diabetes in the young, pharmacogenetics and relevance to multifactorial forms of type 2 diabetes. Endocr. Rev. 2008;29:254–264. - PubMed
    1. Schwitzgebel V.M. Many faces of monogenic diabetes. J. Diabetes Investig. 2014;5:121–133. - PMC - PubMed
    1. Bamshad M.J., Ng S.B., Bigham A.W., Tabor H.K., Emond M.J., Nickerson D.A., Shendure J. Exome sequencing as a tool for Mendelian disease gene discovery. Nat. Rev. Genet. 2011;12:745–755. - PubMed
    1. Doria A., Yang Y., Malecki M., Scotti S., Dreyfus J., O’Keeffe C., Orban T., Warram J.H., Krolewski A.S. Phenotypic characteristics of early-onset autosomal-dominant type 2 diabetes unlinked to known maturity-onset diabetes of the young (MODY) genes. Diabetes Care. 1999;22:253–261. - PubMed

Publication types