. 2015 Jun 15:5:10745.
doi: 10.1038/srep10745.

Electron Tomography Analysis of Tick-Borne Encephalitis Virus Infection in Human Neurons

Affiliations

Electron Tomography Analysis of Tick-Borne Encephalitis Virus Infection in Human Neurons

Tomáš Bílý et al. Sci Rep. .

Abstract

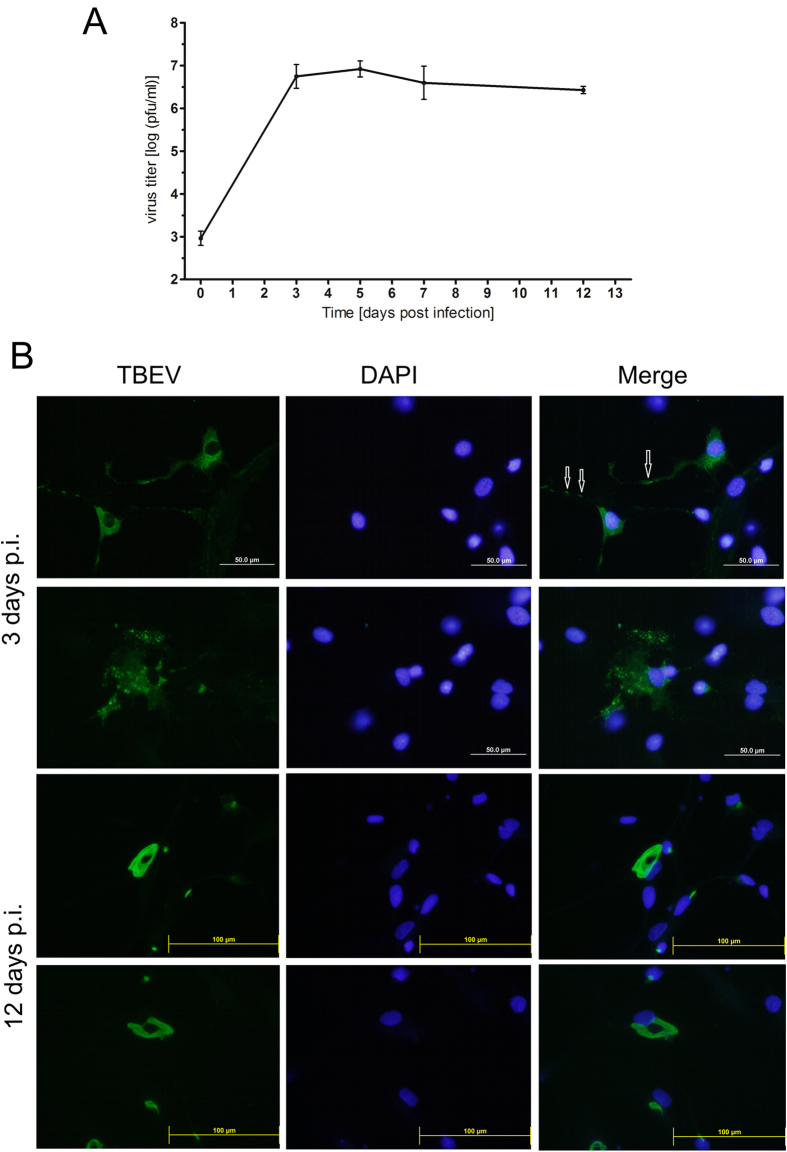
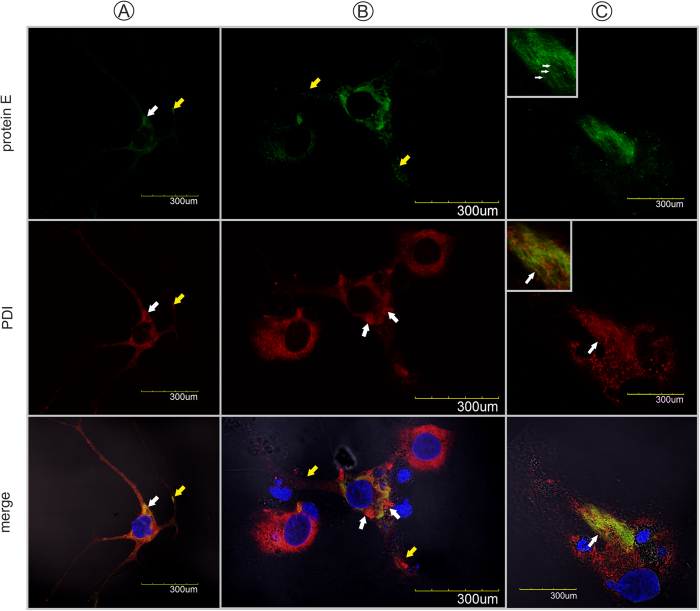
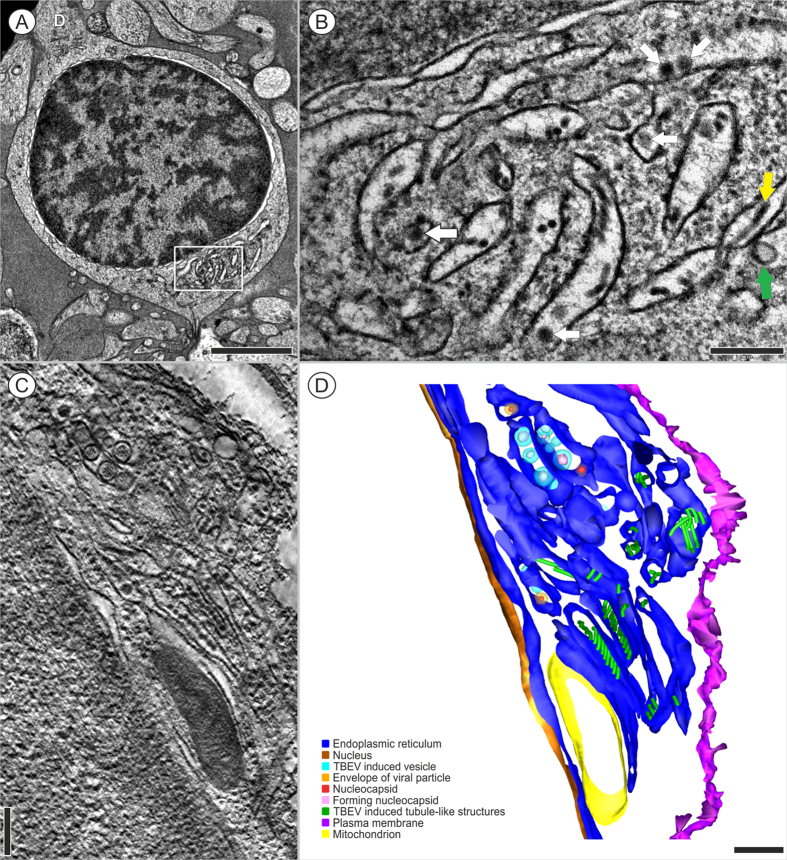
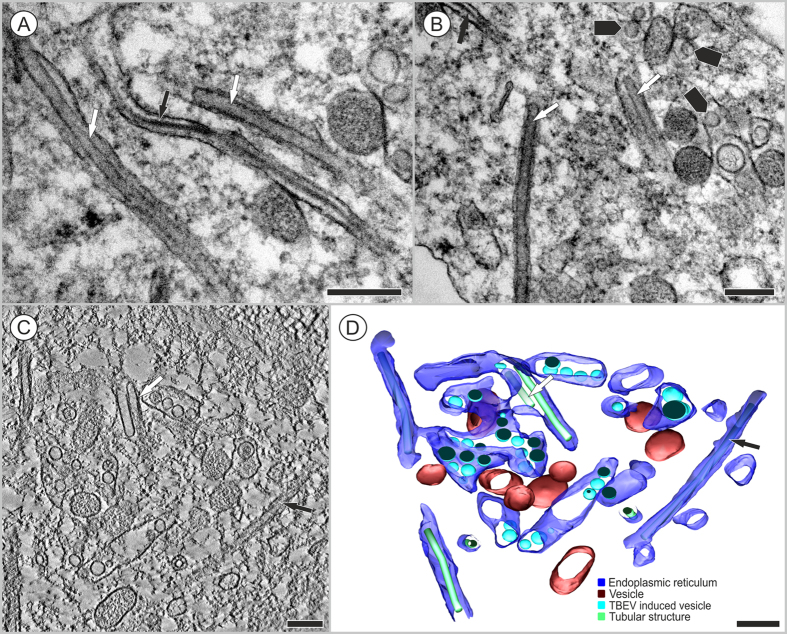
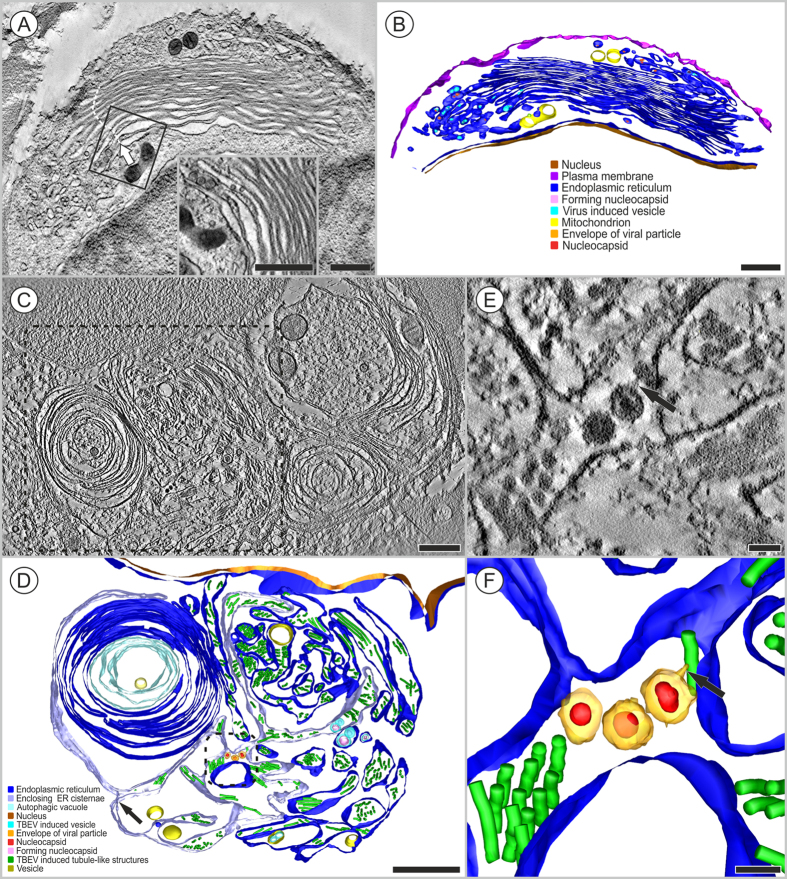
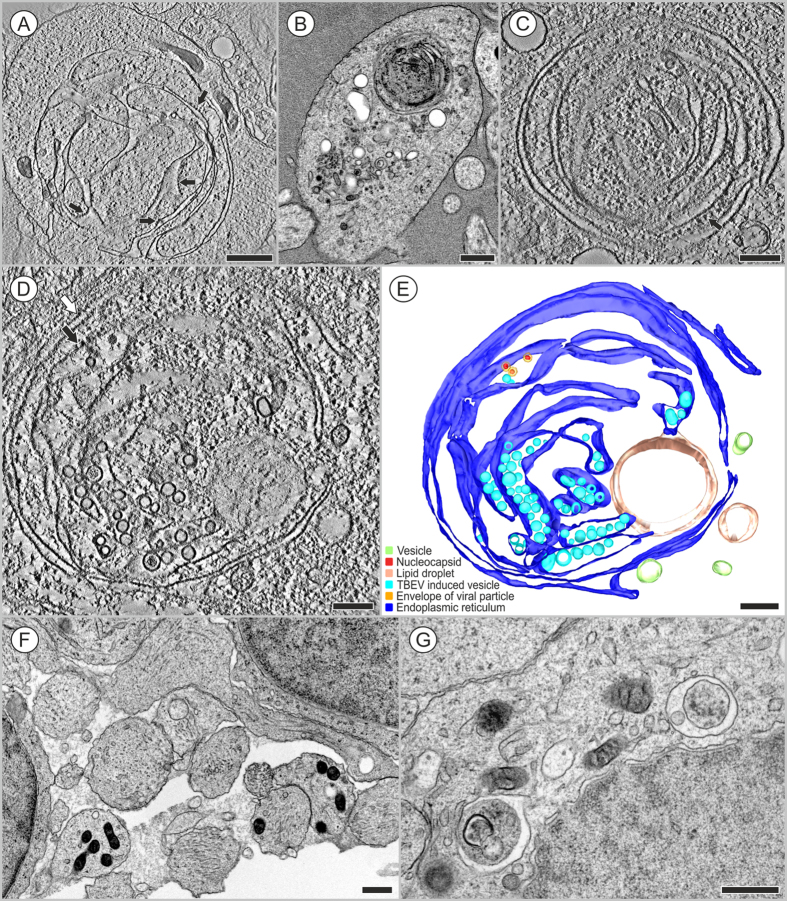
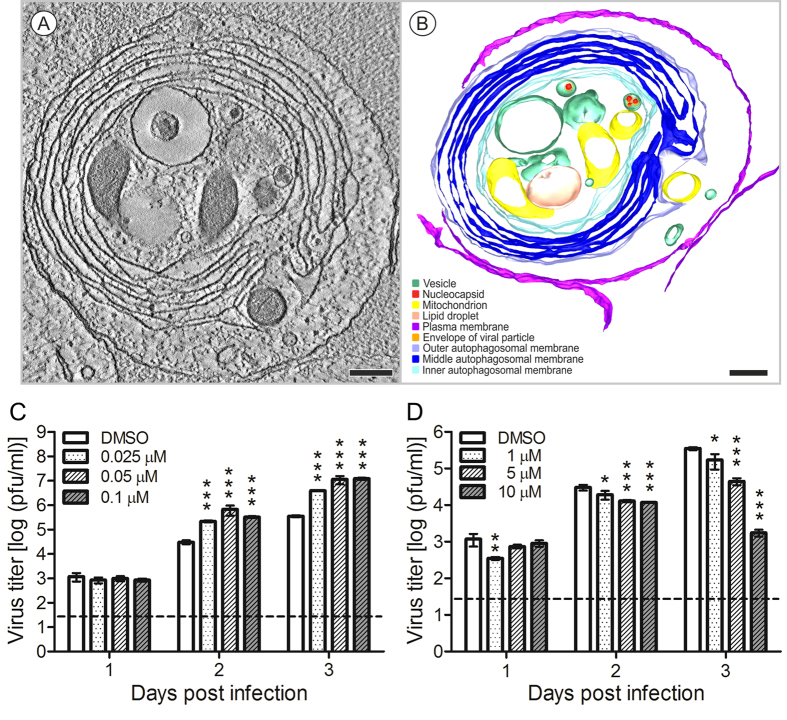
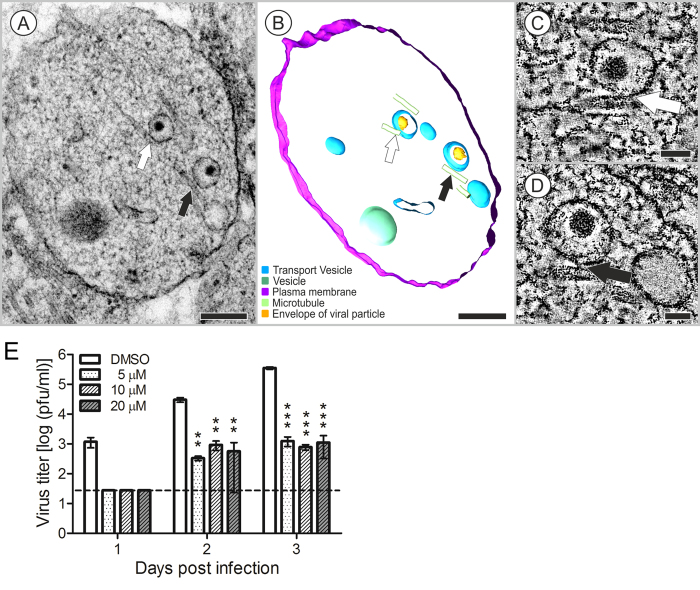
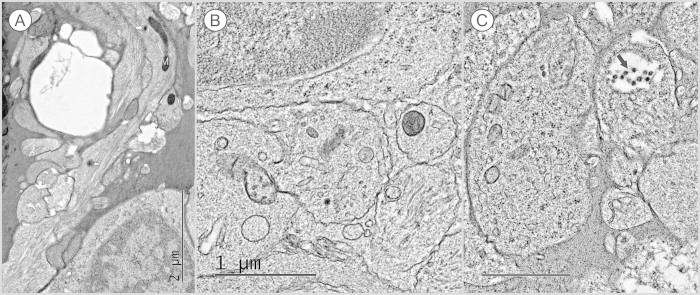
Tick-borne encephalitis virus (TBEV) causes serious, potentially fatal neurological infections that affect humans in endemic regions of Europe and Asia. Neurons are the primary target for TBEV infection in the central nervous system. However, knowledge about this viral infection and virus-induced neuronal injury is fragmental. Here, we directly examined the pathology that occurs after TBEV infection in human primary neurons. We exploited the advantages of advanced high-pressure freezing and freeze-substitution techniques to achieve optimal preservation of infected cell architecture. Electron tomographic (ET) reconstructions elucidated high-resolution 3D images of the proliferating endoplasmic reticulum, and individual tubule-like structures of different diameters in the endoplasmic reticulum cisternae of single cells. ET revealed direct connections between the tubule-like structures and viral particles in the endoplasmic reticulum. Furthermore, ET showed connections between cellular microtubules and vacuoles that harbored the TBEV virions in neuronal extensions. This study was the first to characterize the 3D topographical organization of membranous whorls and autophagic vacuoles in TBEV-infected human neurons. The functional importance of autophagy during TBEV replication was studied in human neuroblastoma cells; stimulation of autophagy resulted in significantly increased dose-dependent TBEV production, whereas the inhibition of autophagy showed a profound, dose-dependent decrease of the yield of infectious virus.


Figures

Figure 1
Figure 1. TBEV can infect human neurons.
(A) TBEV titers in culture supernatants from HNs collected at 0, 3, 5, 7, and 12 days post-infection (p.i.) were determined in plaque assays with porcine kidney stable cells. Viral titers are expressed as pfu/ml. Data represent means ± SEM. (B) HNs grown and fixed on slides at days 3 and 12 p.i. were stained with anti-flavivirus envelope antibody (green) and counterstained with DAPI (blue). TBEV-infected HNs immunostained with flavivirus-specific antibody demonstrated virus replication in the cytoplasm at an early time point (3 days p.i.); antigen accumulated into aggregates at later a time point (12 days p.i.). Mock-infected HNs stained with primary and secondary antibodies were used as a negative control, and did not exhibit any TBEV antigen staining (not shown). The arrows indicate accumulation of viral antigen in dendrites of the infected HNs.
Figure 2
Figure 2. Confocal images of human neurons infected with TBEV.
Neurons were fixed at (A,B) 3 days p.i. and (C) 12 days p.i. and double immunolabeled with antibodies against TBEV protein E (green) (top panels), PDIA3 (red) (middle panels), and (merge panels) counterstained with DAPI. (A) Replication complexes were observed in the perikaryon (white arrow) and dendrites (yellow arrow). (B) Infected cells with intact endoplasmic reticulum networks were observed next to infected cells with large whorls (white arrows). (C) Localization of viral protein E in the numerous longitudinal fibers (white arrows) associated with the ER.
Figure 3
Figure 3. HNs infected with TBEV for 3 days.
(A) A neuron with two cytoplasmic extensions on opposite sides of the cell body. D- Dendrite. (B) Detail of the boxed region in (A) shows the RER, which contains viral particles (44.75 nm, n = 4, white arrows), virus-induced vesicles (green arrow), and tubule-like structures (yellow arrow). (C,D) The presence of tubule-like structures (22 ± 1.3 nm, N = 51) inside the RER. (C) A slice of the tomogram was rendered as (D) a 3D reconstruction of a single axis of the tomogram. A series of images were collected in a ±65° tilt range with 0.65° increments. Pixel resolution: 1.1 nm. This single-axis tomogram is shown in movie S1. Bars: (A) 2 mm, (B-D) 200 nm. The transmission electron microscope images were acquired with (A,B) a JEOL 1010 80 kV and (C,D) a JEOL F2100 200 kV.
Figure 4
Figure 4. Tubule-like structures of different diameters were localized inside a single neuron infected with TBEV.
Transmission electron microscope images were acquired at (A) 3 days p.i. or (B) 12 days p.i. (A) Inside the ER, tubules of 43.8 ± 4.3 nm (N = 7) in diameter (white arrows) were observed; other cisternae contained tubules of 22 ± 1.3 nm in diameter (black arrow). (B) The TBEV infection induced ER rearrangements (black arrowheads). (C) A slice of the tomogram and (D) a 3D reconstruction of a single axis tomogram. Tilt series images were collected in the ±65° tilt range with 1° increments. Pixel resolution: 0.8 nm. This single-axis tomogram is shown in movie S2. Bars: 200 nm. (AD) The transmission electron microscope images were acquired with a JEOL F2100 200 kV.
Figure 5
Figure 5. Proliferation of the endoplasmic reticulum observed in HNs infected with TBEV.
Transmission electron microscope images were acquired at (A,B) 3 days p.i. and (CE) 12 days p.i. (A) TBEV particles and TBEV-induced vesicles are located inside the proliferated and reorganized cisterns of the rough endoplasmic reticulum; the boxed region is enlarged in the inset. (B) The image in (A) was rendered as a colored 3D model. (C) Large whorls are clearly observed in abnormal endoplasmic reticulum. (D) The boxed region in (C) is rendered in a 3D model to clarify the different components. (D) Lamellar whorls are surrounded by cisternae (light purple) arising (arrow) from the rough endoplasmic reticulum (blue), which accommodates tubule-like structures (green). The central part of the whorls comprises concentric circles of flattened ER cisternae (light blue). We observed several lipid droplets (yellow) in proximity of the whorls. (E) Detailed image of the boxed region in (D) shows the connection between a TBEV particle and a tubule-like structure (arrow) inside the rough endoplasmic reticulum. (F) The image in (E) was rendered as a colored 3D model. (A) A single axis tomogram; ±65° tilt range with 0.65° increments, pixel resolution: 2.2 nm; (C) a single axis tomogram, 2 × 2 montage, ±65° tilt range with 1° increments, pixel resolution: 0.8 nm. Bars: (AD) 500 nm, (E,F) 50 nm. (AF) The transmission electron microscope images were acquired with JEOL F2100 200 kV.
Figure 6
Figure 6. Formation of autophagic vacuoles in HNs infected with TBEV.
Transmission electron microscope images were acquired at (AC) 3 days p.i., (D,E) 12 days p.i., and in (F,G) mock-infected cells. (A,B) The RER (ribosomes are indicated with black arrows), which contain TBEV particles and virus-induced structures, were nearly completely sequestered by peripheral cisterns (see electron tomography in supplement) in neuronal extensions. (C) Detail of (B) shows the coiled RER with TBEV-induced structures. (D) The cisterns of the RER (ribosomes indicated with black arrow) with replicating TBEV particles and virus-induced vesicles are surrounded by one flattened ER cistern that nearly encloses this space, and a lipid droplet. Enclosing cisternae of the ER were devoid of ribosomes (white arrow). (E) 3D model of (D). (F) Similar vacuoles/autophagosomes were not observed in control neuronal extensions. (G) Several vacuoles that sequestered cell parts (debris, fragments of degraded membranes) were found in the cell body of control neurons. Bars: (A,B,F,G) 500 nm, (CE) 200 nm. (A,C,D) Slices of a single axis tomogram; ±65° tilt range with 1° increments, pixel resolution: (A) 1.1 nm, (C) 0.7 nm; (D) 0.8 nm. Transmission electron microscope images were acquired with (A,CE) JEOL f2100 200 kV and (B,F,G) JEOL 1010 80 kV.
Figure 7
Figure 7. An autophagosome in a neural extension observed 3 days after TBEV infection.
The cytoplasm contains mitochondria and TBEV particles in vacuoles, encircled by several double membranous structures, apparently of RER origin (but devoid of ribosomes). (A) A slice of a single axis tomogram; ±65° tilt range with 0.6° increments, pixel resolution: 0.8 nm. (B) A 3D model of (A). Bars: 200 nm. (A,B) Transmission electron microscope images were acquired with JEOL F2100 200 kV. (C,D) Autophagy enhanced TBEV production in human neuroblastoma cells. The cells were pretreated with the solvent control (DMSO), rapamycin (0.025, 0.05, or 0.1 μM) (C), or spautin-1 (1, 5, or 10 μM) (D) then infected with TBEV at m.o.i. of 0.1 pfu per cell for 24, 48, or 72 hours. The culture supernatants were collected for plaque assay on PS cells. The virus titers (pfu/ml) are shown as the means ± SEM. The horizontal dashed line indicates the minimum detectable threshold. *p < 0.05; **p < 0.01; ***p < 0.001.
Figure 8
Figure 8. Two vacuoles that accommodated TBEV particles in a neuronal extension at 12 days after infection.
(AD) Arrows indicate connections between vacuoles and microtubules. (A) The projection image and (B) the 3D model. (C,D) Images show slices of a double-axis tomogram acquired with a ± 60° tilt range in 0.6° increments; pixel resolution: 0.55 nm Bars: (A,B) 200 nm; (C,D) 50 nm. Transmission electron microscope images were acquired with (A) JEOL 1010 80 kV and (C,D) JEOL F2100 200 kV. (E) Nocodazole treatment inhibits TBEV replication in human neuroblastoma cells. The cells were pretreated with the solvent control (DMSO), or nocodazole (5, 10, or 20 μM) then infected with TBEV at m.o.i. of 0.1 pfu per cell for 24, 48, or 72 hours. The culture supernatants were collected for plaque assay on PS cells. The virus titers (pfu/ml) are shown as the means ± SEM. The horizontal dashed line indicates the minimum detectable threshold. **p < 0.01; ***p < 0.001.
Figure 9
Figure 9. Mock infected HNs examined at 3 days p.i.
(A,B) HN extensions contained a few probable secretion granules with electron-dense cores, with diameters of (A) about 70 nm and (B) 90 nm, that were in direct contact with the cytoplasm. (C) Different vesicles of 43.8 nm (n = 5) in diameter were located outside the cells (black arrow). Bar 1 μm. (AC) Transmission electron microscope images were acquired with JEOL 1010 80 kV.

References

    1. Mansfield K. L. et al. Tick-borne encephalitis virus - a review of an emerging zoonosis. J. Gen. Virol. 90, 1781–94 (2009). - PubMed
    1. Růžek D., Dobler G., & Donoso Mantke O. Tick-borne encephalitis: pathogenesis and clinical implications. Travel Med. Infect. Dis. 8, 223–32 (2010). - PubMed
    1. Růžek D., Salát J., Singh S. K., & Kopecký J. Breakdown of the blood-brain barrier during tick-borne encephalitis in mice is not dependent on CD8+ T-cells. PLoS One 6, e20472 (2011). - PMC - PubMed
    1. Gelpi E. et al. Visualization of Central European tick-borne encephalitis infection in fatal human cases. J. Neuropathol. Exp. Neurol. 64, 506–12 (2005). - PubMed
    1. Gelpi E. et al. Inflammatory response in human tick-borne encephalitis: analysis of postmortem brain tissue. J. Neurovirol. 12, 322–7 (2006). - PubMed

Publication types

MeSH terms

LinkOut - more resources