. 2015 Dec:123:253-68.
doi: 10.1016/j.neuroimage.2015.05.092. Epub 2015 Jun 11.

Multi-level block permutation

Affiliations

Multi-level block permutation

Anderson M Winkler et al. Neuroimage. 2015 Dec.

Abstract

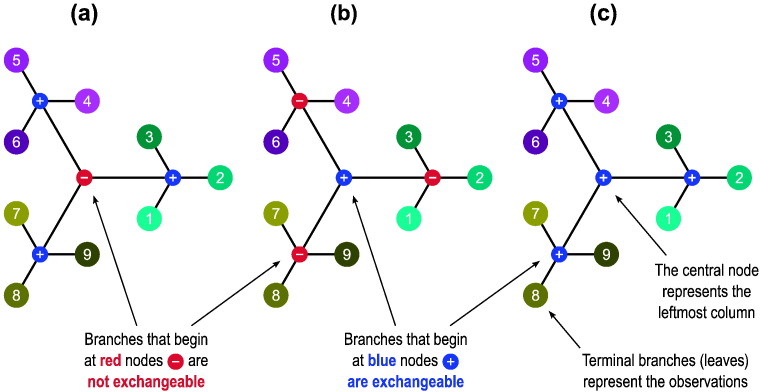
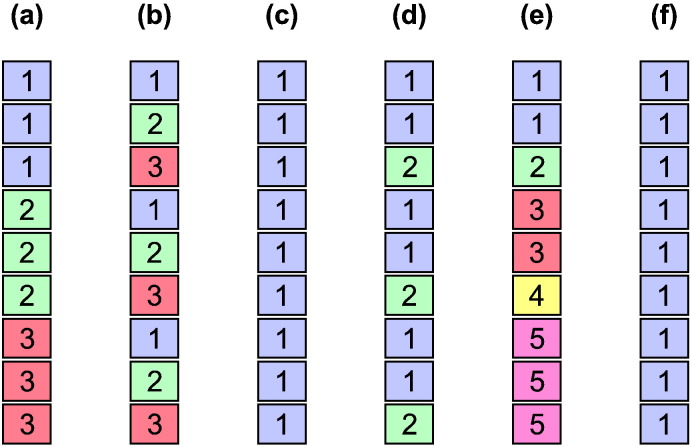
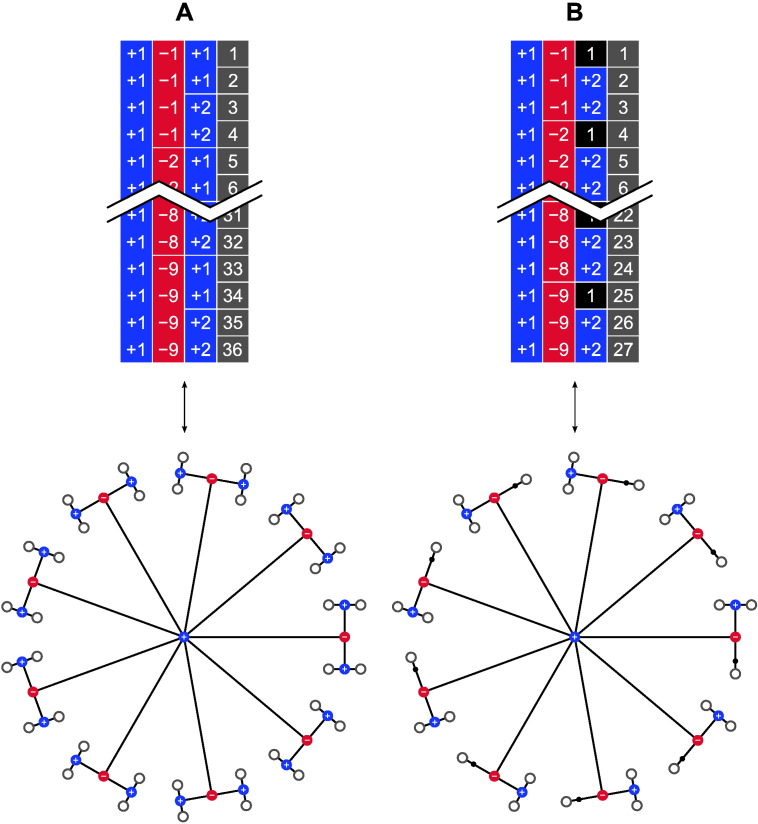
Under weak and reasonable assumptions, mainly that data are exchangeable under the null hypothesis, permutation tests can provide exact control of false positives and allow the use of various non-standard statistics. There are, however, various common examples in which global exchangeability can be violated, including paired tests, tests that involve repeated measurements, tests in which subjects are relatives (members of pedigrees) - any dataset with known dependence among observations. In these cases, some permutations, if performed, would create data that would not possess the original dependence structure, and thus, should not be used to construct the reference (null) distribution. To allow permutation inference in such cases, we test the null hypothesis using only a subset of all otherwise possible permutations, i.e., using only the rearrangements of the data that respect exchangeability, thus retaining the original joint distribution unaltered. In a previous study, we defined exchangeability for blocks of data, as opposed to each datum individually, then allowing permutations to happen within block, or the blocks as a whole to be permuted. Here we extend that notion to allow blocks to be nested, in a hierarchical, multi-level definition. We do not explicitly model the degree of dependence between observations, only the lack of independence; the dependence is implicitly accounted for by the hierarchy and by the permutation scheme. The strategy is compatible with heteroscedasticity and variance groups, and can be used with permutations, sign flippings, or both combined. We evaluate the method for various dependence structures, apply it to real data from the Human Connectome Project (HCP) as an example application, show that false positives can be avoided in such cases, and provide a software implementation of the proposed approach.

Keywords: General linear model; Multiple regression; Permutation inference; Repeated measurements.


Figures

Fig. 1
Fig. 1
Different notations for the specification of exchangeability blocks; in this example, 3 blocks of 3 observations each. Left: In a single-column notation, each block has its index (here 1, 2, and 3, shown in different, random colours for clarity), and either within- or whole-block exchangeability are possible, but not both simultaneously. The specification of which kind of shuffling is to be done requires extra information, as a flag passed to the algorithm that permutes the data. Right: In a multiple-column notation, that information is encoded by virtue of the indices having a sign indicating whether the exchangeable units of a block at a given level should be shuffled as a whole (+) or kept fixed (−); these are shown respectively in blue and red. The signs define whether it is possible to perform rearrangements within-block, or of the blocks as a whole, or both. The rightmost example serves only to illustrate the notation, and is not useful in practice as all the observations would need to remain still. The letters (a) through (c) refer to the visual representations in Fig. 2. Bottom: Example permutations are shown, with the observation indices coloured for clarity.
Fig. 2
Fig. 2
Visual representations for the multi-level notation in the examples (a)–(c) from Fig. 1, and using the same colour scheme. The levels can be depicted as branching from a central (top) node, akin to a tree in which the most peripheral elements (leaves) represent the observations. The nodes from which the branches depart can be labelled as allowing permutations (+) or not (−), shown respectively here in blue and red colours.
Fig. 3
Fig. 3
The multi-level definition of blocks allows more complex relationships between observations. Left: Three blocks of identical structure (2nd column) can be shuffled as a whole (as indicated by the positive indices in the 1st column); within each (3rd column), only two out of their three constituting observations can be swapped (1 and 2, 4 and 5, and 7 and 8), whereas the third on each (3, 6 and 9) cannot; levels for these last branches are completed with blocks for which the sign has no meaning (in black), as they remain unaltered towards the next level (4th column), and represent no actual branching. In the visual representation, these black blocks are shown as small black dots on continuous branches. This example could represent 3 sets of siblings, each composed of a pair of monozygotic twins and a third non-twin. Centre: An example showing that it is possible to mix types of blocks in the same level (2nd column). As shown, the first two blocks in the 2nd column cannot be swapped despite similar coding, and neither of these can be permuted with the third, which has a different structure consisting of three observations (7, 8 and 9) that can be shuffled freely. This example could represent 3 sets of siblings, the first a pair of monozygotic twins and a non-twin, the second a pair of dizygotic twins and a non-twin (if certain environmental effects are considered), and the third a set of three non-twin siblings. Right: The same notation can also accommodate simple designs. Here all 9 observations can be permuted without restrictions on exchangeability.
Fig. 4
Fig. 4
Variance groups defined from the exchangeability blocks (a)–(c) shown in Fig. 1, and (d)–(f) in Fig. 3. These are the most restrictive configurations for the vgs that are possible given the structure imposed by the ebs. If, however, despite the covariance structure between observations, their variances are known to be or can be assumed to be homogeneous, some or all of these groups can be merged, with the additional benefit of improving the variance estimates. Alternatively, the groups can be entirely replaced by a different definition if additional information from the variance of the data is available. In (e), note two groups with only one observation each; see the main text for details.
Fig. 5
Fig. 5
The two dependence structures, a and b, used to assess error rates and power. Top: Multi-level block definition. Bottom: Visualisation as a tree diagram.
Fig. 6
Fig. 6
Tree diagrams c–g, used to assess power, in addition to a, b, h and i (shown in Fig. 5, Fig. 7, Fig. 8). In c, observations can be shuffled without restrictions. In d, which represent a set of five sibships, mz refers to each subject of a pair of monozygotic twins, dz to dizygotic twins, and fs to full siblings (non-twin and not half siblings); the numbers in parentheses indicate the number of each type of sibship in the tree (see also Fig. 7). In e, observations can be shuffled only within-block; in f the blocks as a whole can be shuffled, and in g, shufflings are allowed within-block, and the blocks as a whole can also be shuffled.
Fig. 7
Fig. 7
Tree diagram depicting the structure present among the subjects of the Human Connectome Project hcp, at the time of the release hcp-s500, with 518 subjects. The numbers in parentheses indicate how many of each type of sibship set are present.
Fig. 8
Fig. 8
Tree diagram representing the structure among the same 518 subjects of the hcp-s500 release, shown in Fig. 7, but treating dizygotic twins as ordinary siblings, therefore not accounting for the possibility of shared common non-genetic effects within dizygotic twin pair.
Fig. 9
Fig. 9
Changes in power related well to the average Hamming distance across permutations for the nine simulated datasets a–i (see also Table 4). When all dots are considered, R2 = 0.7557 for a linear fit (dashed line); when only the centres of mass for each dataset (marked with “×” and indicated with arrows) are considered, R2 = 0.9902.
Fig. 10
Fig. 10
Maps showing the locations of the peaks of significance, for positive (+) and negative (−) correlations of height, weight, and bmi with cortical surface area and thickness. For conciseness, and given their lack of overlap, the original maps for thickness were thresholded at 0.05 and added together, allowing the regions to be displayed in the same figure. Even after using fwer-correction across the brain and contrasts, the unrestricted shuffling identified seemingly significant regions; these regions were not found significant using the restricted permutations that respect the family structure in the hcp sample. Provided that these traits are highly non-independent between subjects (i.e., heritable) this suggests that these results, produced with simple, unrestricted permutation, are in fact false positives (the peaks of significance for both restricted and unrestricted are listed in Supplementary Table 3).

References

    1. Almasy L., Blangero J. Multipoint quantitative-trait linkage analysis in general pedigrees. Am. J. Hum. Genet. 1998;62(5):1198–1211. - PMC - PubMed
    1. Anderson M.J., Legendre P. An empirical comparison of permutation methods for tests of partial regression coefficients in a linear model. J. Stat. Comput. Simul. 1999;62(3):271–303.
    1. Barch D.M., Burgess G.C., Harms M.P., Petersen S.E., Schlaggar B.L., Corbetta M., Glasser M.F., Curtiss S., Dixit S., Feldt C., Nolan D., Bryant E., Hartley T., Footer O., Bjork J.M., Poldrack R., Smith S., Johansen-Berg H., Snyder A.Z., Van Essen D.C. Function in the human connectome: task-fMRI and individual differences in behavior. NeuroImage. 2013;80:169–189. - PMC - PubMed
    1. Bland J.M., Altman D.G. Statistical methods for assessing agreement between two methods of clinical measurement. Lancet. 1986;327(8476):307–310. - PubMed
    1. Bond D.J., Ha T.H., Lang D.J., Su W., Torres I.J., Honer W.G., Lam R.W., Yatham L.N. Body mass index-related regional gray and white matter volume reductions in first-episode mania patients. Biol. Psychiatry. 2014;76(2):138–145. - PubMed

Publication types