. 2013 Dec 16;40(23):6165-6170.
doi: 10.1002/2013GL058088. Epub 2013 Dec 11.

The deep permafrost carbon pool of the Yedoma region in Siberia and Alaska

Affiliations

The deep permafrost carbon pool of the Yedoma region in Siberia and Alaska

Jens Strauss et al. Geophys Res Lett. .

Abstract

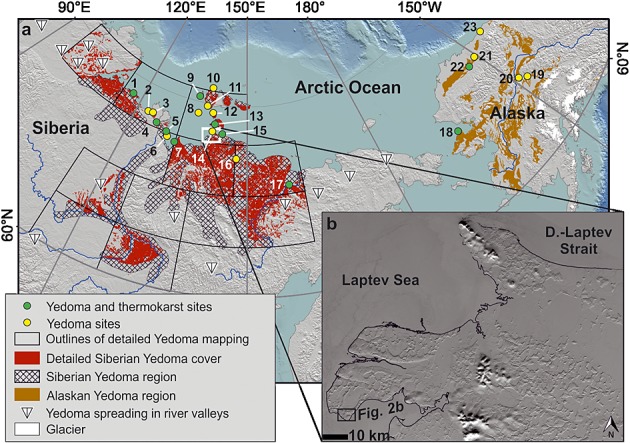
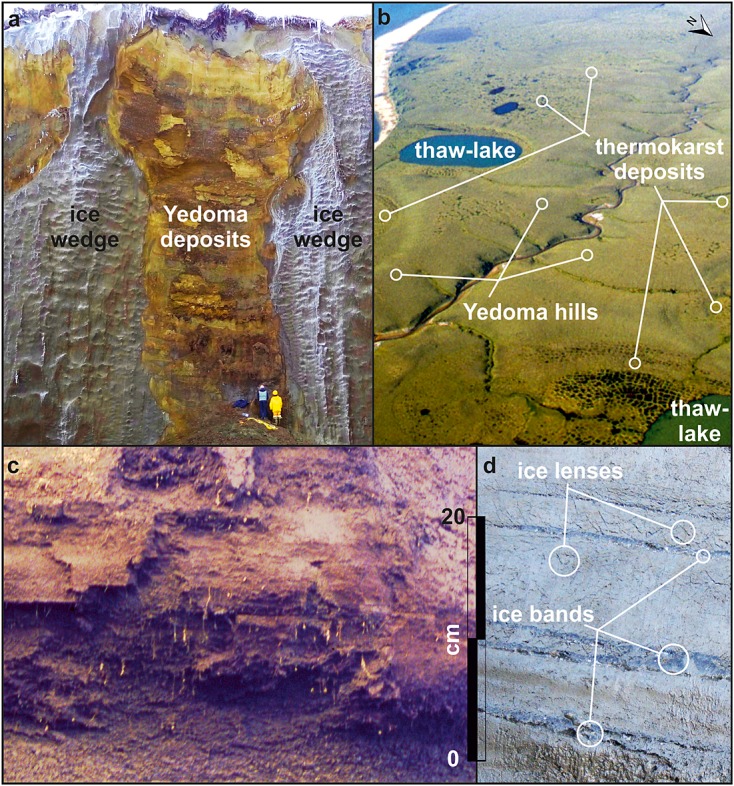
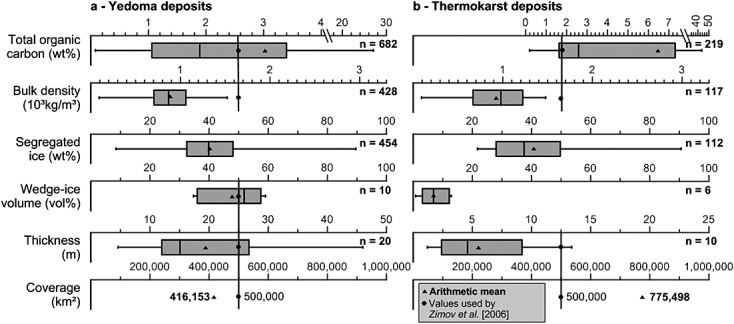
[1] Estimates for circumpolar permafrost organic carbon (OC) storage suggest that this pool contains twice the amount of current atmospheric carbon. The Yedoma region sequestered substantial quantities of OC and is unique because its deep OC, which was incorporated into permafrost during ice age conditions. Rapid inclusion of labile organic matter into permafrost halted decomposition and resulted in a deep long-term sink. We show that the deep frozen OC in the Yedoma region consists of two distinct major subreservoirs: Yedoma deposits (late Pleistocene ice- and organic-rich silty sediments) and deposits formed in thaw-lake basins (generalized as thermokarst deposits). We quantified the OC pool based on field data and extrapolation using geospatial data sets to 83 + 61/-57 Gt for Yedoma deposits and to 128 + 99/-96 Gt for thermokarst deposits. The total Yedoma region 211 + 160/-153 Gt is a substantial amount of thaw-vulnerable OC that must be accounted for in global models.

Keywords: Arctic; Yedoma; carbon cycle; climate feedback; frozen organic matter; thermokarst.


Figures

Figure 1
Figure 1
Location of the study sites. (a) Potential [after Romanovskii, 1993] and fragmented [Jorgenson et al., ; Grosse et al., 2013] area of Yedoma deposits in Arctic and sub-Arctic lowlands, including the studied thermokarst deposit areas. Sites are numbered; 1, Cape Mamontov Klyk; 2, Nagym Island; 3, Khardang Island; 4, Kurungnakh Island; 5, Bykovsky Peninsula; 6, Muostakh Island; 7, Buor Khaya Peninsula; 8, Stolbovoy Island; 9, Bel'kovsky Island; 10 and 11, Kotel'ny Island; 12, Maly Lyakhovsky Island; 13, Bol'shoy Lyakhovsky Island; 14, Cape Svyatov Nos; 15, Oyogos Yar; 16, Kytalyk; 17, Duvanny Yar; 18, Kitluk River; 19, Vault Creek tunnel; 20, Dalton Highway; 21, Itkillik River; 22, Colville River; and 23, Camden Bay. For site 18, only thermokarst deposit samples are available, resulting in 22 Yedoma and 10 thermokarst deposit sites. (b) A panchromatic Landsat-7 image of the wintery Svyatoy Nos and Shirokostan peninsulas (12 March 2012, extent of the white box shown in a), illustrating several granite domes mantled by Yedoma deposits and strong dissection by thermokarst depressions (Landsat data source: USGS EROS Data Center). The black box marks the location of the area shown in Figure 2b.
Figure 2
Figure 2
Pictures of studied deposits. (a) Yedoma deposits with wedge ice (WI) exposed at the Itkillik River, Alaska (Figure 1, site 21, photo from J. Strauss [2012]); (b) photo of a Yedoma-thermokarst landscape on Shirokostan Peninsula, Laptev Sea (black box in Figure 1b, photo from L. Schirrmeister [1999]); (c) example of fossil root-bearing Yedoma deposits from Bykovsky Peninsula, Laptev Sea (Figure 1, site 5, photo from L. Schirrmeister [1998]); and (d) example of segregated ice (SEI) (ice lenses and ice bands) at Buor Khaya Peninsula (Figure 1, site 7, photo from J. Strauss [2010]).
Figure 3
Figure 3
Box plots of the key parameters for (a) Yedoma and (b) thermokarst deposit organic carbon estimation. The literature estimate [Zimov et al., 2006] is given by the vertical black line for comparison. Note the different axis scale in Figures 3a and 3b for total organic carbon (TOC) and thickness. Tables S2–S5 (SI) contain these parameters with uncertainty estimates.

References

    1. Battle M, Bender ML, Tans PP, White JWC, Ellis JT, Conway T. Francey RJ. Global carbon sinks and their variability inferred from atmospheric O2 and δ13C. Science. 2000;287(5462):2467–2470. doi:10.1126/science.287.5462.2467. - PubMed
    1. Burke EJ, Hartley IP. Jones CD. Uncertainties in the global temperature change caused by carbon release from permafrost thawing. The Cryosphere. 2012;6(5):1063–1076. doi:10.5194/tc-6-1063-2012.
    1. Ciais P. Large inert carbon pool in the terrestrial biosphere during the Last Glacial Maximum. Nat. Geosci. 2012;5(1):74–79. doi:10.1038/ngeo1324.
    1. Cory RM, Crump BC, Dobkowski JA. Kling GW. Surface exposure to sunlight stimulates CO2 release from permafrost soil carbon in the Arctic. Proc. Natl. Acad. Sci. U. S. A. 2013;110(9):3429–3434. doi:10.1073/pnas.1214104110. - PMC - PubMed
    1. DeConto RM, Galeotti S, Pagani M, Tracy D, Schaefer K, Zhang T, Pollard D. Beerling DJ. Past extreme warming events linked to massive carbon release from thawing permafrost. Nature. 2012;484(7392):87–91. doi:10.1038/nature10929. - PubMed

LinkOut - more resources