

Short-term and long-term risk factors in gastric cancer
- PMID: 26074682
- PMCID: PMC4458754
- DOI: 10.3748/wjg.v21.i21.6434
Short-term and long-term risk factors in gastric cancer
Abstract
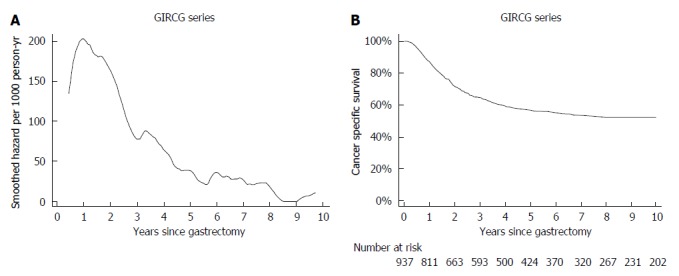
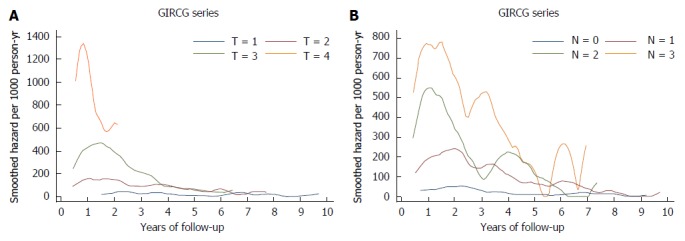
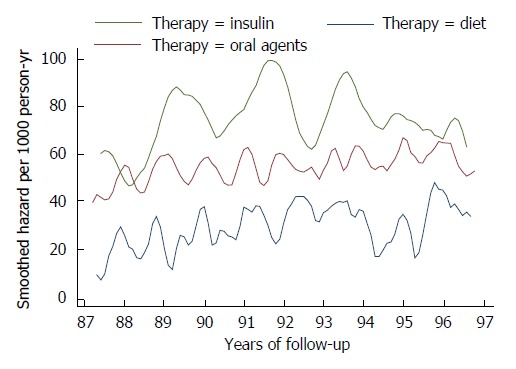
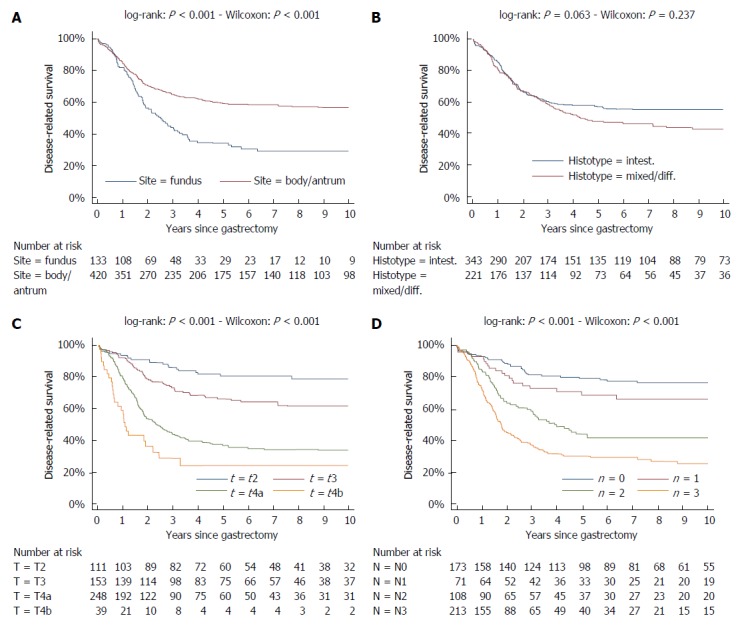
While in chronic diseases, such as diabetes, mortality rates slowly increases with age, in oncological series mortality usually changes dramatically during the follow-up, often in an unpredictable pattern. For instance, in gastric cancer mortality peaks in the first two years of follow-up and declines thereafter. Also several risk factors, such as TNM stage, largely affect mortality in the first years after surgery, while afterward their effect tends to fade. Temporal trends in mortality were compared between a gastric cancer series and a cohort of type 2 diabetic patients. For this purpose, 937 patients, undergoing curative gastrectomy with D1/D2/D3 lymphadenectomy for gastric cancer in three GIRCG (Gruppo Italiano Ricerca Cancro Gastrico = Italian Research Group for Gastric Cancer) centers, were compared with 7148 type 2 diabetic patients from the Verona Diabetes Study. In the early/advanced gastric cancer series, mortality from recurrence peaked to 200 deaths per 1000 person-years 1 year after gastrectomy and then declined, becoming lower than 40 deaths per 1000 person-years after 5 years and lower than 20 deaths after 8 years. Mortality peak occurred earlier in more advanced T and N tiers. At variance, in the Verona diabetic cohort overall mortality slowly increased during a 10-year follow-up, with ageing of the type 2 diabetic patients. Seasonal oscillations were also recorded, mortality being higher during winter than during summer. Also the most important prognostic factors presented a different temporal pattern in the two diseases: while the prognostic significance of T and N stage markedly decrease over time, differences in survival among patients treated with diet, oral hypoglycemic drugs or insulin were consistent throughout the follow-up. Time variations in prognostic significance of main risk factors, their impact on survival analysis and possible solutions were evaluated in another GIRCG series of 568 patients with advanced gastric cancer, undergoing curative gastrectomy with D2/D3 lymphadenectomy. Survival curves in the two different histotypes (intestinal and mixed/diffuse) were superimposed in the first three years of follow-up and diverged thereafter. Likewise, survival curves as a function of site (fundus vs body/antrum) started to diverge after the first year. On the contrary, survival curves differed among age classes from the very beginning, due to different post-operative mortality, which increased from 0.5% in patients aged 65-74 years to 9.9% in patients aged 75-91 years; this discrepancy later disappeared. Accordingly, the proportional hazards assumption of the Cox model was violated, as regards age, site and histology. To cope with this problem, multivariable survival analysis was performed by separately considering either the first two years of follow-up or subsequent years. Histology and site were significant predictors only after two years, while T and N, although significant both in the short-term and in the long-term, became less important in the second part of follow-up. Increasing age was associated with higher mortality in the first two years, but not thereafter. Splitting survival time when performing survival analysis allows to distinguish between short-term and long-term risk factors. Alternative statistical solutions could be to exclude post-operative mortality, to introduce in the model time-dependent covariates or to stratify on variables violating proportionality assumption.
Keywords: Cox model; Gastric cancer; Long-term risk factors; Mortality; Proportional hazards assumption; Short-term risk factors; Survival analysis; Type 2 diabetes.
Figures


References
-
- Ferlay J, Soerjomataram I, Ervik M, Dikshit R, Eser S, Mathers C, Rebelo M, Parkin DM, Forman D, Bray F. GLOBOCAN 2012: Estimated Cancer Incidence, Mortality and Prevalence Worldwide in 2012. Available from: http://globocan.iarc.fr. - PubMed
-
- Edge SB, Byrd DR, Compton CC, Fritz AG, Greene FL, Trotti A, editors . AJCC Cancer Staging Handbook. 7th ed. New York: Springer-Verlag; 2010.
-
- Otsuji E, Kobayashi S, Okamoto K, Hagiwara A, Yamagishi H. Is timing of death from tumor recurrence predictable after curative resection for gastric cancer? World J Surg. 2001;25:1373–1376. - PubMed
-
- Kim Y, Ejaz A, Spolverato G, Squires MH, Poultsides G, Fields RC, Bloomston M, Weber SM, Votanopoulos K, Acher AW, et al. Conditional survival after surgical resection of gastric cancer: a multi-institutional analysis of the US Gastric Cancer Collaborative. Ann Surg Oncol. 2015;22:557–564. - PubMed
Publication types
MeSH terms
LinkOut - more resources
Full Text Sources
Other Literature Sources
Medical
